
All-in-one Dashboard
Core inputs and core outputs


This auto repair shop business plan includes a full suite of pro forma statements, CAPEX schedules, and staffing modules tailored for a high-volume collision repair environment.
Core inputs and core outputs
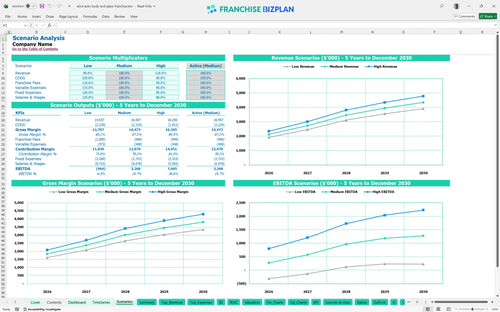
Three scenario analysis
Presentation ready
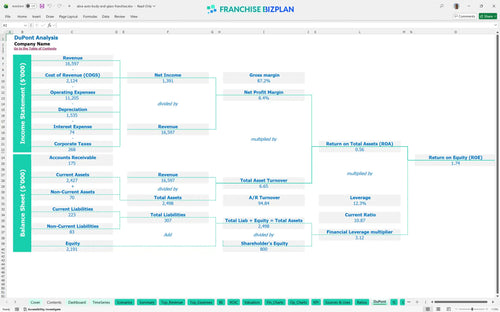
DuPont analysis
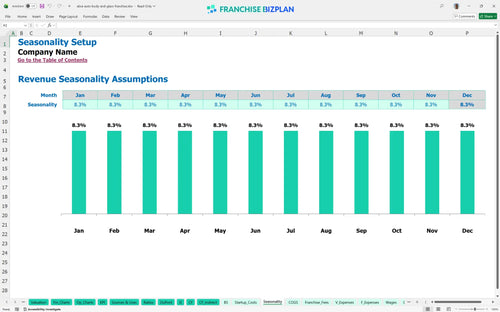
Researched revenue assumptions
Lender-friendly financial outputs
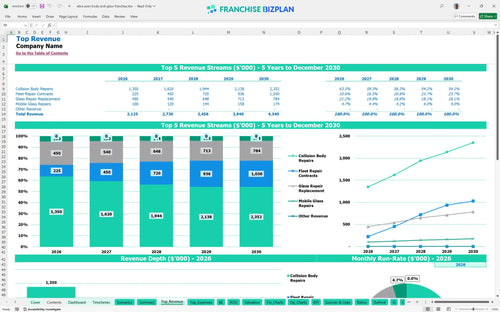
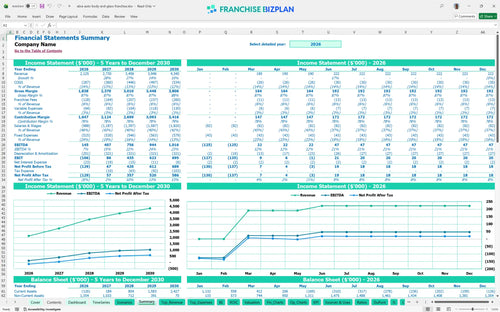
Revenue stream detailed view
Performance metrics benchmark
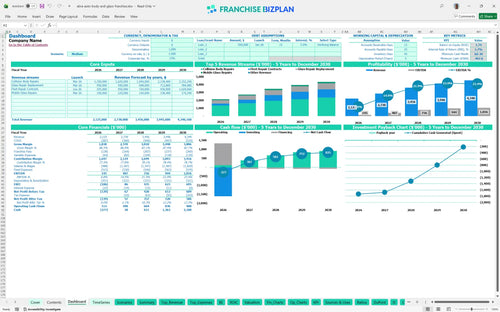
We built this auto body franchise financial model using our own research into the collision repair sector. Key assumptions for revenue streams, operating expenses, and the 5% royalty fee structure are pre-populated and fully editable. With a year-one revenue projection of $2.125 million and a clear path to a $1.01 million EBITDA, this tool helps you navigate the high-stakes startup phase.
The unit reaches a positive EBITDA of $145,000 in the first year, with significant scaling as fleet contracts kick in. By year three, earnings hit $756,000 as the shop reaches higher throughput. Net profit grows as fixed costs like the $25,000 monthly rent become a smaller percentage of total sales.
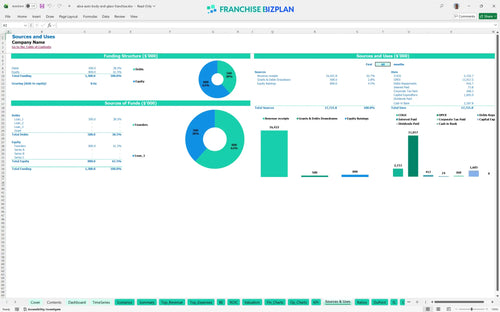
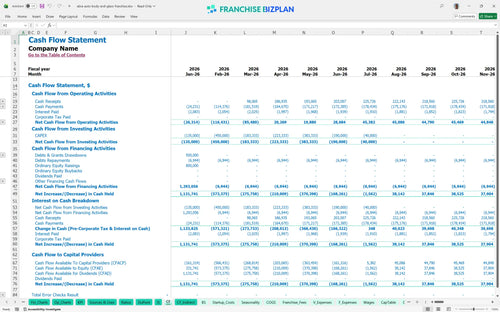
You will need a substantial initial investment to cover the $1.6M in startup costs, including a $35,000 franchise fee and $600,000 for leasehold improvements. The model also accounts for a $468,000 cash dip during the ramp-up phase. Having a solid cash buffer is vital when you're spending $350,000 just on paint booth installation.
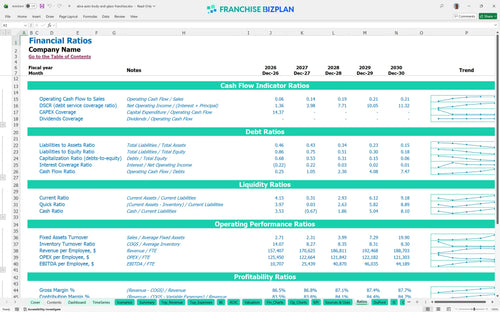
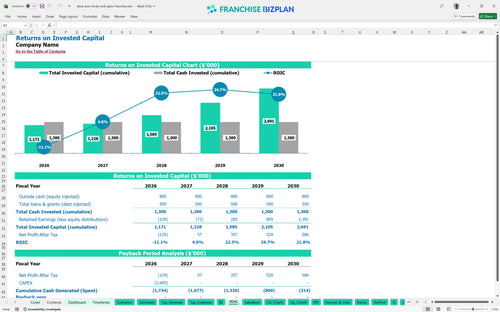
The model shows an IRR and ROE of 1.74%, with a payback period extending beyond the five-year mark. While the annual EBITDA is strong at $1.01M by year five, the heavy initial capital expenditure of over $1.5M means you are playing a long game. You are playing a long game with this capital-intensive model.
You hit the break-even date in April 2026, just four months after launching. This quick turn depends heavily on hitting your initial collision repair volume of $900,000 in the first year. If your $25,000 monthly rent or $50,000 service advisor payroll isn't supported by steady car counts, that date will defintely slide.
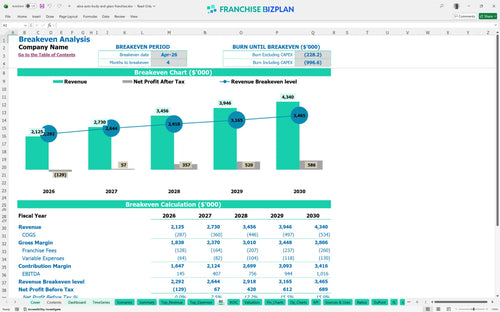
Your lowest cash point is -$468,000 in July 2026, which represents the peak of your investment before cash flow turns positive. You need enough working capital to survive the first seven months of operations. Still, the model suggests a buffer is necessary to handle the timing gaps between insurance payouts and technician payroll.
Moving from the medium to the high scenario can accelerate your payback by increasing the $4.3M revenue ceiling. A low-performance case where revenue drops by 20% would likely push the cash trough deeper than the current $468,000 deficit. High-case success depends on your ability to maximize the $1.5M collision repair stream.
This auto body franchise financial model is fully customizable in Excel, allowing you to swap out default values for your specific territory. You can adjust local labor rates or rent costs to see how they impact your bottom line. It's a flexible tool designed to handle the moving parts of a collision center without breaking the math.

We mapped out a 60-month path showing revenue scaling from $2.12M in year one to over $4.3M by year five. This long-term view helps you track how EBITDA grows as you add technicians and secure fleet contracts. Understanding the jump from $145,000 to $1,016,000 in annual earnings is key for planning your expansion.

Operating within a system means accounting for the 5% royalty and 1% marketing fee on every dollar of sales. This model bakes those costs directly into your monthly cash flow so there are no surprises when the franchisor drafts your account. It's about seeing the true net margin after the brand takes its cut for support and national advertising.

Launching a collision center requires significant upfront capital for paint booths and frame machines. Our break-even analysis shows exactly when your monthly revenue covers these high fixed costs, which happens around April 2026 in our base model. Knowing you need to hit that volume early helps focus your local marketing efforts from day one.

We included industry-standard ranges for parts margins and labor percentages to help you sanity-check your shop's performance. If your paint and supply costs drift above the 3.5% target, the model flags it so you can investigate waste or theft. It's like having a seasoned shop auditor looking over your shoulder to keep margins tight.


Simply purchase and download the financial model template, then access it instantly using Microsoft Excel or Google Sheets. No installation or technical expertise required-just open and start working.

Enter your business-specific numbers, including revenue projections, costs, and investment details. The pre-built formulas will automatically calculate financial insights, saving you time and effort.

Leverage the investor-ready format to confidently showcase your financial projections to banks, franchise representatives, or investors. Impress stakeholders with clear, data-driven insights and professional reports.

Leverage the investor-ready format to confidently present your projections to banks, franchise representatives, or investors.