
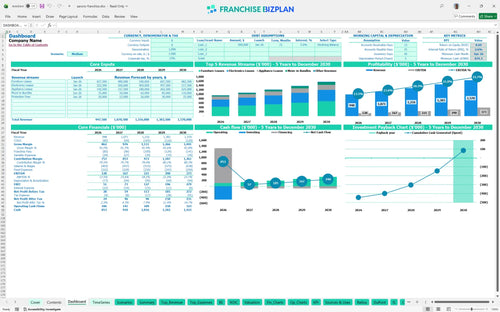
All-in-one Dashboard
Core inputs and core outputs


This template provides a complete franchise unit profitability calculator with integrated cash flow, income statement, and balance sheet modules for a single retail location.
Core inputs and core outputs
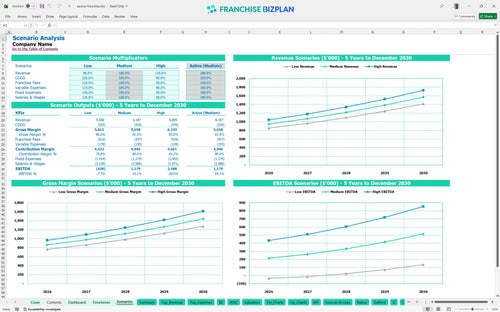
Three scenario analysis
Presentation ready
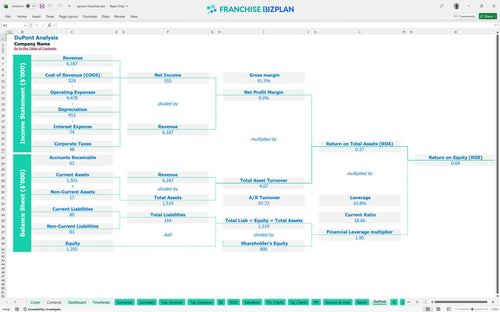
DuPont analysis
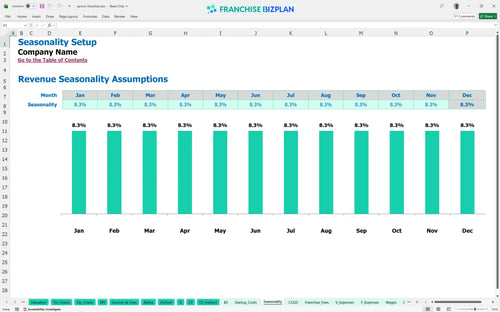
Researched revenue assumptions
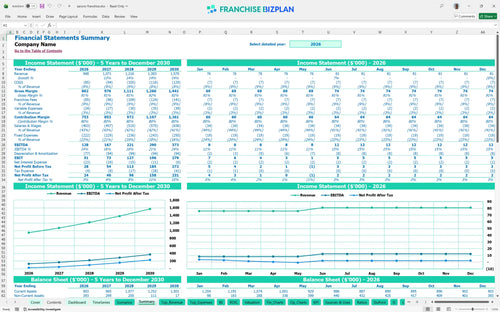
Lender-friendly financial outputs
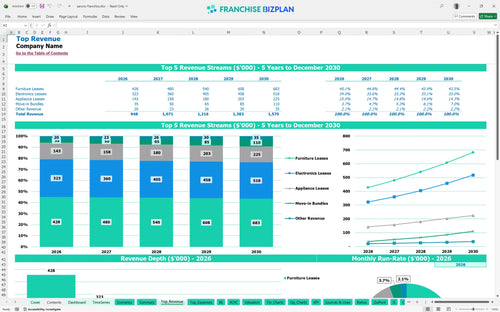
Revenue stream detailed view
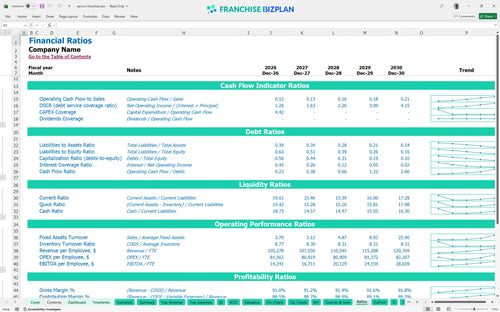
Performance metrics benchmark
We built this franchise unit financial model using our own research on the lease-to-own sector. Key assumptions like the 6% royalty and $13,000 monthly rent are pre-populated and fully editable to help you how to forecast recurring revenue for a franchise. With Year 1 EBITDA starting at $128,000, this model helps you map the path to a five-year payback period.
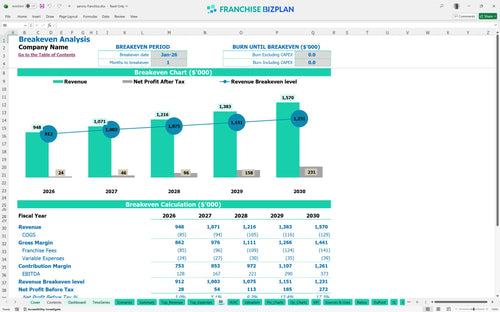
The unit reaches profitability almost immediately, with a break-even date of January 2026. After accounting for COGS, 9% total franchise fees, and $156,000 in annual rent, the store generates $128,000 in EBITDA during its first full year.
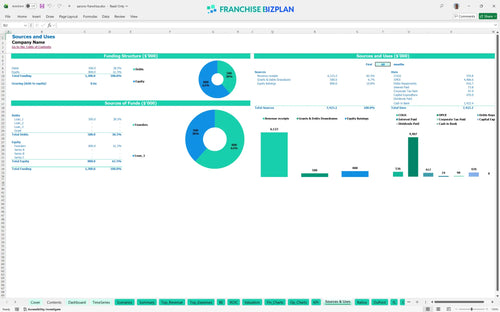
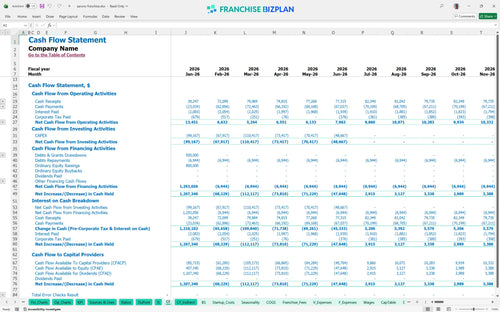
You need roughly $470,000 in startup capital requirements for retail franchise launch. This covers the $50,000 franchise fee, $220,000 for leasehold improvements, and $75,000 for showroom fixtures. You should also account for the minimum cash point of $834,000 in June 2026 to handle the ramp-up phase.
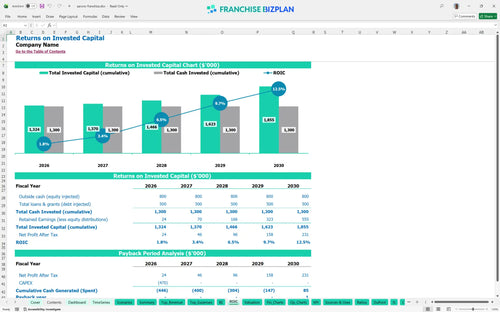
The franchise ROI shows an Internal Rate of Return (IRR) of 2.56% and a Return on Equity (ROE) of 0.69. While the payback period is 5 years, the EBITDA grows significantly to $373,000 by year five, showing strong long-term cash flow potential for a multi-unit operator.
The model shows a break-even date in January 2026, just one month after launch. To cover the $18,500 in monthly fixed costs plus labor, you need to focus on furniture store franchise investment analysis and high-volume lease renewals. Operational overhead remains the biggest hurdle to monthly profitability.
The lowest cash point occurs in June 2026 at $834,000. Predicting franchise unit cash flow is critical here, as you have $470,000 in upfront CAPEX and a growing payroll that starts with a $65,000 store manager and two delivery drivers. This franchise financial model excel template helps you visualize that dip.
Your retail franchise operational expense planning must account for fluctuations in lease volume. High scenarios significantly improve the year-1 EBITDA of $128,000, while low scenarios might extend the 5-year payback period. Honestly, hitting the high case defintely depends on local marketing execution and property management partnerships.
Finance: update unit break-even and payback model by Friday
This franchise financial model is built in Excel with editable assumptions and pre-filled formulas. You can adjust the lease-to-own franchise model to fit your specific San Antonio territory or retail corridor by changing the drivers for furniture, electronics, and appliances.

Map out your retail franchise business plan with detailed five-year forecasts. The model covers revenue growth from $948,000 in year one to over $1.5 million by year five, ensuring you see the long-term cash flow potential of the unit.

Track every dollar of your franchise startup costs, including the $50,000 initial fee. The model automatically calculates how to calculate franchise startup costs and ongoing obligations like the 6% royalty and 3% marketing fund contributions based on monthly lease revenue.

Use the break-even analysis to identify the exact volume needed to cover your $13,000 monthly rent and labor costs. This tool helps you plan for the capital expenditure required to get the doors open, including $220,000 for leasehold improvements and $55,000 for delivery vehicles. This franchise profit and loss template ensures no hidden costs surprise you.

Compare your store-level performance against standard retail franchise financial projections spreadsheet data. We use researched unit economics and benchmarks for labor and occupancy to ensure your lease-to-own business financial model remains realistic and competitive in the San Antonio market.


Simply purchase and download the financial model template, then access it instantly using Microsoft Excel or Google Sheets. No installation or technical expertise required-just open and start working.

Enter your business-specific numbers, including revenue projections, costs, and investment details. The pre-built formulas will automatically calculate financial insights, saving you time and effort.

Leverage the investor-ready format to confidently showcase your financial projections to banks, franchise representatives, or investors. Impress stakeholders with clear, data-driven insights and professional reports.

Leverage the investor-ready format to confidently present your projections to banks, franchise representatives, or investors.