


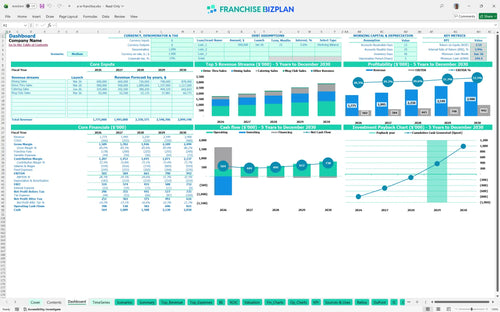
All-in-one Dashboard
Core inputs and core outputs



This comprehensive Excel template for franchise unit financial forecasting includes everything from CAPEX schedules and payroll calculators to 5-year P&L statements and cash flow trackers.
Core inputs and core outputs
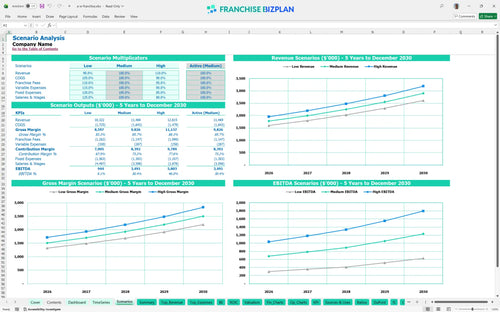
Three scenario analysis
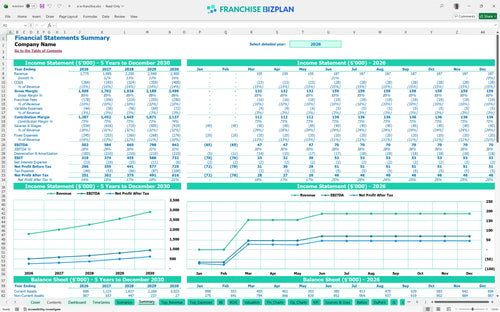
Presentation ready
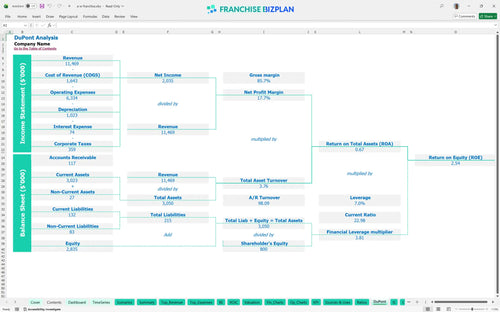
DuPont analysis
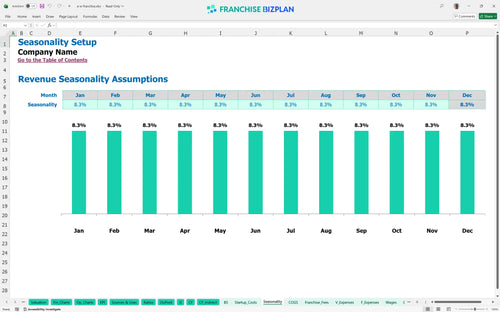
Researched revenue assumptions
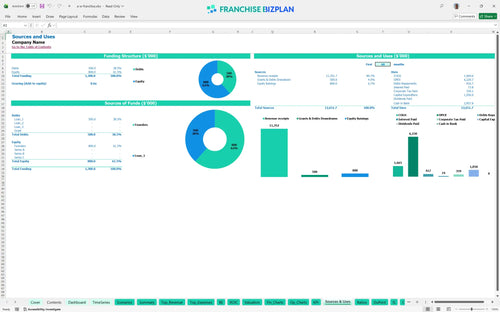
Lender-friendly financial outputs
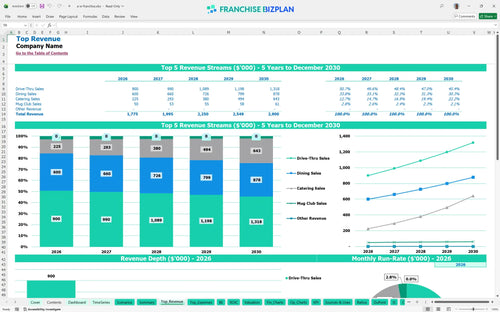
Revenue stream detailed view
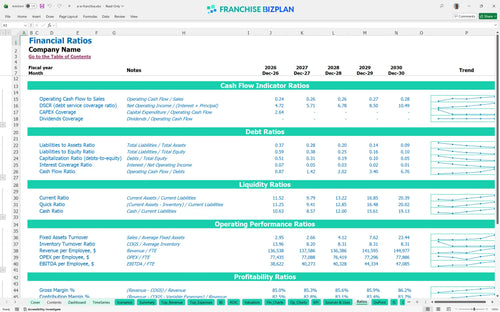
Performance metrics benchmark
We built this franchise unit financial model using our own research into the quick-service industry and modern-retro concepts. Key assumptions, including the $1.77M Year 1 revenue target and the 10% combined royalty and marketing fee, are pre-populated but fully editable to fit your specific market. This tool defintely helps you move from a 'gut feeling' to a data-driven investment decision.
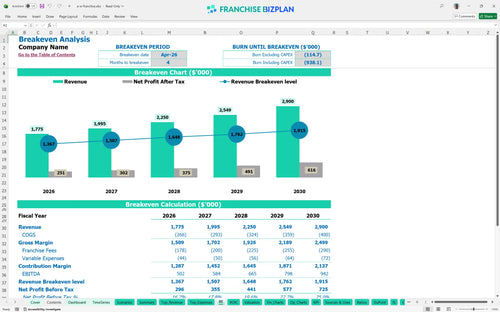
The model shows this unit reaching its break-even date in April 2026, just four months after the January launch. With Year 1 EBITDA projected at $502,000, the unit becomes profitable quickly because the high-volume drive-thru and dining sales offset the fixed costs early in the ramp-up phase.
You need $1,050,000 in total capital for the initial build-out and fees. This includes the $30,000 franchise fee and $450,000 for leasehold improvements. The model also accounts for a $244,000 minimum cash buffer needed by June 2026 to handle the initial working capital swing during the first six months of trading.
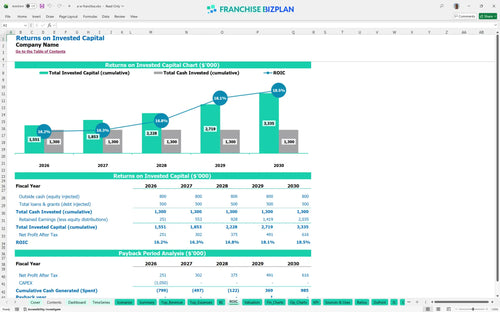
Based on the $1.05M investment, the model projects an Internal Rate of Return (IRR) of 3.9% and a Return on Equity (ROE) of 2.54. The years to payback is estimated at 4 years, which is standard for a high-CAPEX restaurant franchise investment analysis Excel template where equipment and build-out costs are significant.
The monthly break-even point is reached when revenue covers the $14,000 prime location rent and the 10% royalty burden. In this model, that happens at month 4. Unit economics modeling suggests that maintaining a high average ticket through the 'Mug Club' is the fastest way to stabilize your margin above fixed overhead.
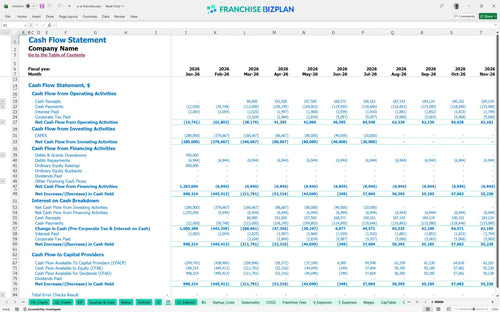
Your lowest cash point occurs in June 2026 at $244,000. This is the 'danger zone' where pre-opening costs have been spent but catering and drive-thru revenue haven't fully matured. The operating cash flow forecast suggests you need at least six months of liquidity to safely navigate the store opening and initial staffing ramp.
In a high-growth scenario where revenue hits the $2.9M Year 5 target, your EBITDA margin improves significantly as fixed costs like the $65,000 manager salary are diluted. A low-revenue scenario would extend the 4-year payback, making a franchise business financial feasibility study critical before signing a 5-year lease.
Finance: update unit break-even and payback model by Friday
This franchise financial model template is built in Excel to give you total control over your unit projections. You can adjust pre-filled formulas and editable assumptions to match your specific territory, whether you are looking at a high-traffic tourist hub or a suburban site. It serves as a comprehensive restaurant franchise business plan tool, allowing you to swap out labor rates, rent, and local tax assumptions without breaking the logic.

Planning for a single location requires looking beyond the first year of operations. This tool provides detailed franchise unit financial projections over a 60-month horizon, mapping out how revenue scales from $1.77 million in year one to $2.9 million by year five. You get a clear view of how margin expansion works as your team gets more efficient and your local brand equity grows.

The model specifically tracks the 5% royalty and 5% marketing fund contributions that define your relationship with the franchisor. By automating these calculations, you can see exactly how much of your $147,000 monthly revenue goes toward brand support before you pay for your hormone-free beef or prime location rent. This level of detail is essential for any serious restaurant franchise business plan.

Estimating fast food franchise startup costs is the first step in any feasibility study. This model aggregates your $30,000 franchise fee, $450,000 in leasehold improvements, and $200,000 in kitchen equipment to show your total entry price. It then calculates the exact volume needed to cover your $14,000 monthly rent and $2,400 utility bills, helping you find the break-even point for franchise unit operations.

We include built-in benchmarks so you can perform a realistic franchise profitability analysis. If your crew member wages for 8 full-time equivalents (FTEs) start to creep above industry norms, the model flags the impact on your store-level EBITDA (earnings before interest, taxes, depreciation, and amortization). It helps you sanity-check if your 13% food ingredient cost is competitive for a premium quick-service concept.


Simply purchase and download the financial model template, then access it instantly using Microsoft Excel or Google Sheets. No installation or technical expertise required-just open and start working.

Enter your business-specific numbers, including revenue projections, costs, and investment details. The pre-built formulas will automatically calculate financial insights, saving you time and effort.

Leverage the investor-ready format to confidently showcase your financial projections to banks, franchise representatives, or investors. Impress stakeholders with clear, data-driven insights and professional reports.

Leverage the investor-ready format to confidently present your projections to banks, franchise representatives, or investors.