
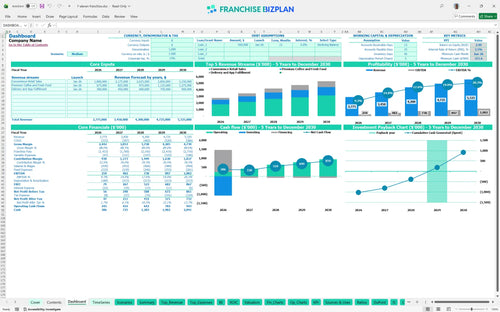
All-in-one Dashboard
Core inputs and core outputs


This convenience store franchise financial model provides a data-driven toolkit to project cash flow, analyze unit economics, and evaluate the total investment for a high-traffic retail location.
Core inputs and core outputs
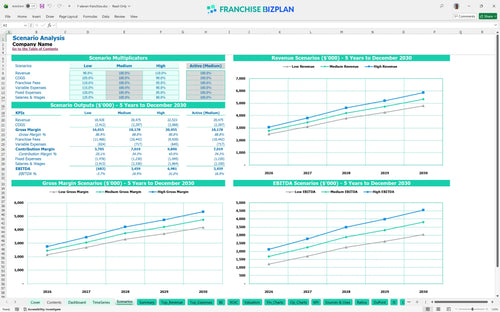
Three scenario analysis
Presentation ready
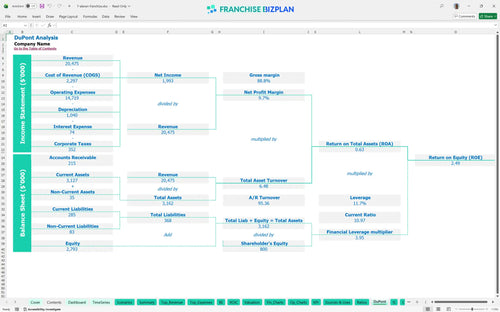
DuPont analysis
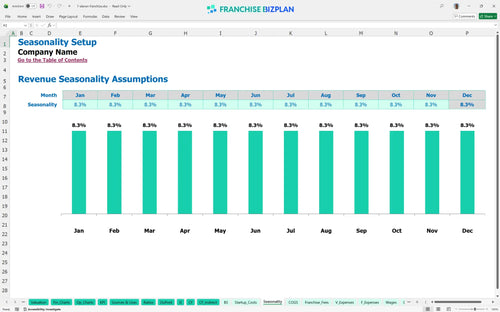
Researched revenue assumptions
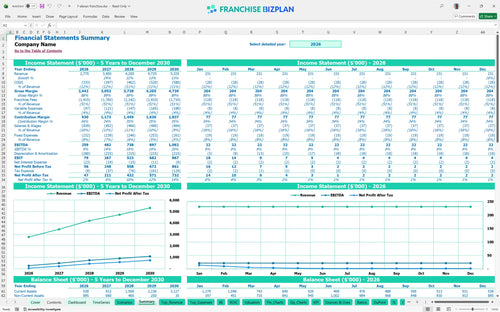
Lender-friendly financial outputs
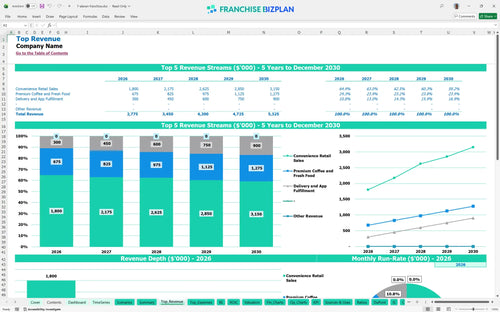
Revenue stream detailed view
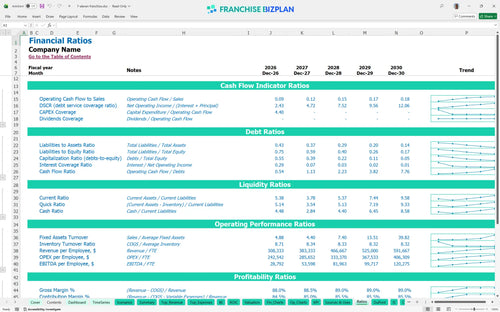
Performance metrics benchmark
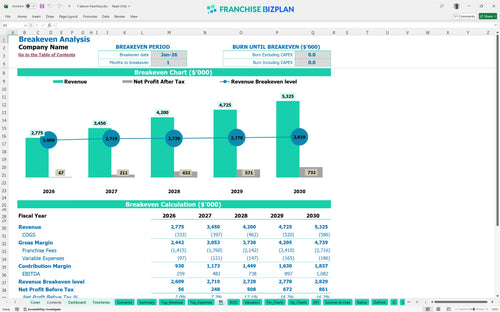
We built this model using detailed research on high-density urban retail units, pre-populating it with assumptions for premium coffee bars and delivery fulfillment. With a Year 1 revenue target of $2,775,000 and EBITDA starting at $259,000, all inputs like the 50% royalty and $15,000 monthly rent are fully editable to match your specific site. Honestly, the model is designed to show you exactly where the cash goes before you commit to the brand standards.
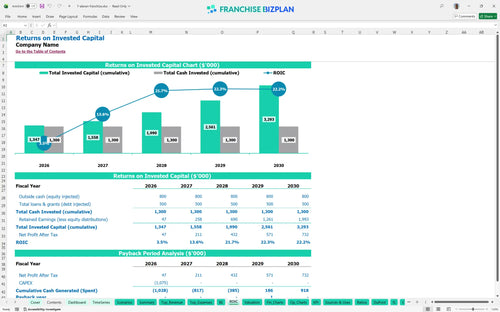
Evaluating profitability for a new franchise unit investment shows a fast start, with the model hitting break-even in January 2026. By Year 5, annual EBITDA is projected to reach $1,082,000, but reaching that level depends on maintaining high-margin fresh food sales and tight retail franchise profitability analysis on your inventory waste.
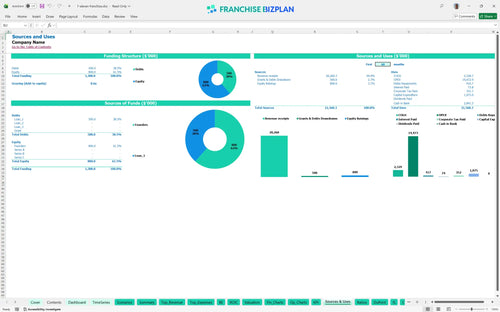
Your franchise startup cost spreadsheet needs to account for $1,075,000 in major capital expenditures, including a $600,000 site build-out. Budgeting for franchise equipment and real estate costs is the biggest hurdle, but the model ensures you have the $50,000 initial inventory stock covered before the doors even open.
The convenience store unit economics and profit margin analysis indicates a 4-year payback period on your initial investment. With an Internal Rate of Return (IRR) of 3.52% and a Return on Equity (ROE) of 2.49, this is defintely a long-term stability play rather than a high-growth tech startup, focusing on steady cash flow from a mature unit.
Financial projections for high-traffic retail franchise locations show that break-even occurs almost immediately due to high volume, but the 50% royalty fee is a massive variable. You need to maintain a high average ticket through the premium coffee bar to offset the $15,000 monthly rent and $19,300 in monthly base salaries for your shift associates.
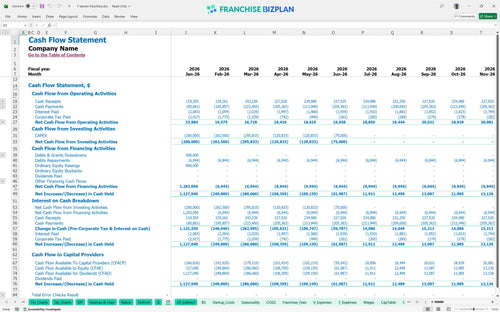
This financial planning guide for retail franchise owners identifies your lowest cash point in June 2026 at $312,000. While the model shows you stay in the black, any delay in your kitchen equipment installation or a slow ramp in delivery app fulfillment will eat into that buffer quickly, so keep a tight grip on your convenience store investment calculator.
Analyzing recurring revenue streams for convenience franchises shows that the 'High' scenario can push Year 5 revenue to $5.3M if you execute local marketing perfectly. Still, the 'Low' case in this franchise business plan template warns that a drop in commuter traffic could squeeze margins, making manager productivity your most important lever for protecting store-level EBITDA.
Finance: update unit break-even and payback model by Friday
This Excel template for retail franchise financial forecasting is fully adaptable, allowing you to tweak every assumption from local labor rates to specific inventory costs. The pre-filled formulas handle the heavy lifting, so you can focus on testing different operating scenarios and location-specific variables without building a sheet from scratch.

Planning for a long-term exit or multi-unit expansion requires a best financial model for retail franchise operations that looks beyond the first year. This model projects five years of revenue, cash flow, and balance sheet health, giving you a clear view of how the unit matures as you capture more local market share.

Estimating royalty and franchise fees for business planning is critical when the franchisor takes a significant cut of the gross margin. This tool includes a dedicated franchise royalty fee calculation engine to track ongoing payments and marketing fund contributions, ensuring you see the true net profit after all brand obligations are met.

Knowing how to calculate startup costs for a convenience store franchise is the first step in de-risking your investment. The model breaks down the total initial investment into clear categories like leaseholds and equipment, then calculates the exact sales volume you need to hit to cover your monthly fixed costs.

We have integrated retail inventory turnover projections and labor benchmarks to help you sanity-check your numbers against industry standards. This ensures your projections for staffing and occupancy stay within a realistic range, helping you spot potential margin leaks before you sign a lease or hire your first manager.


Simply purchase and download the financial model template, then access it instantly using Microsoft Excel or Google Sheets. No installation or technical expertise required-just open and start working.

Enter your business-specific numbers, including revenue projections, costs, and investment details. The pre-built formulas will automatically calculate financial insights, saving you time and effort.

Leverage the investor-ready format to confidently showcase your financial projections to banks, franchise representatives, or investors. Impress stakeholders with clear, data-driven insights and professional reports.

Leverage the investor-ready format to confidently present your projections to banks, franchise representatives, or investors.