
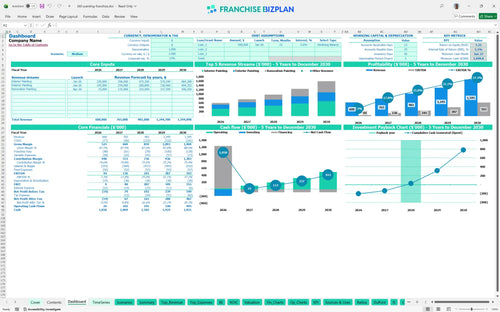
All-in-one Dashboard
Core inputs and core outputs


This tool provides a complete franchise unit P&L statement template for owners including automated cash flow, CAPEX tracking, and detailed staffing plans.
Core inputs and core outputs
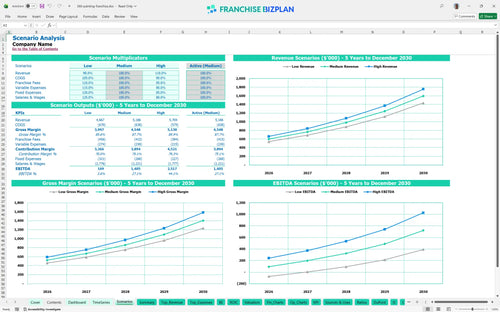
Three scenario analysis
Presentation ready
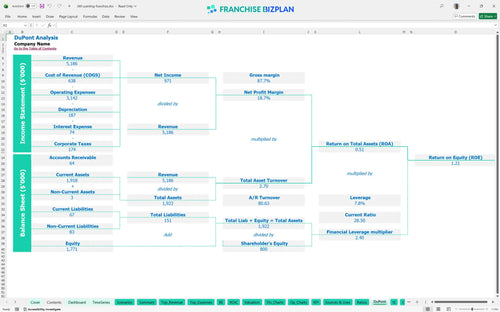
DuPont analysis
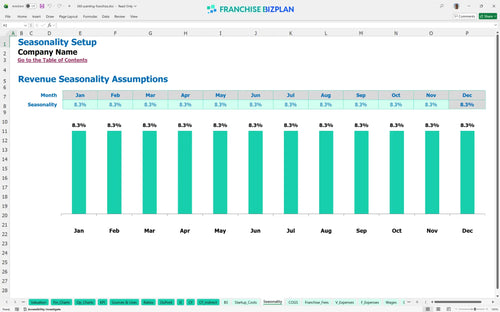
Researched revenue assumptions
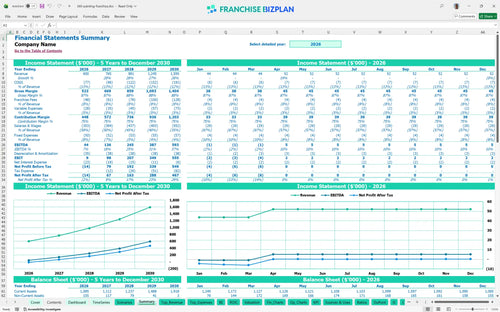
Lender-friendly financial outputs
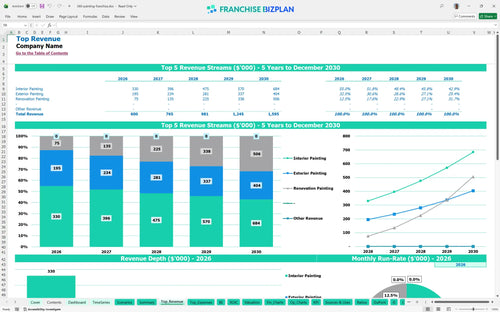
Revenue stream detailed view
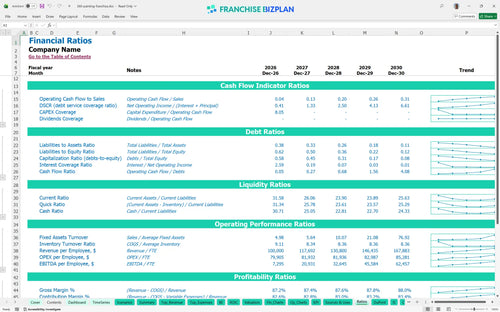
Performance metrics benchmark
We built this franchise unit financial model using our own research into the painting industry and franchise standards. Key assumptions like the $65,000 franchise fee and 6% royalty are pre-populated but fully editable to match your specific FDD. With a year-five EBITDA projection of $593,000, this model helps you plan for a high-performance service business.
This unit hits its stride quickly, showing a positive EBITDA of $44,000 in the first year. By year three, as you scale into renovation painting and optimize your crew, profitability grows significantly with a projected EBITDA of $245,000. Efficiency and crew productivity are the main drivers of this growth.
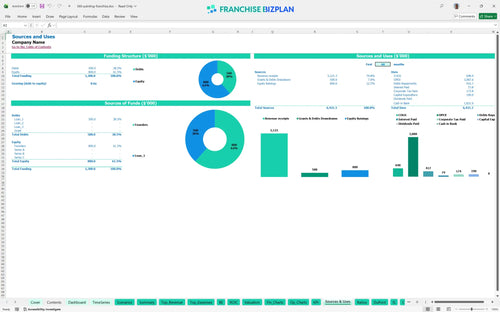
You defintely need a solid start, with total CAPEX reaching $190,000 to get fully operational across all categories. This covers the $65,000 franchise fee, $50,000 for service vehicles, and $25,000 for painting equipment. Budgeting for a new home improvement franchise requires accounting for these heavy upfront asset costs.
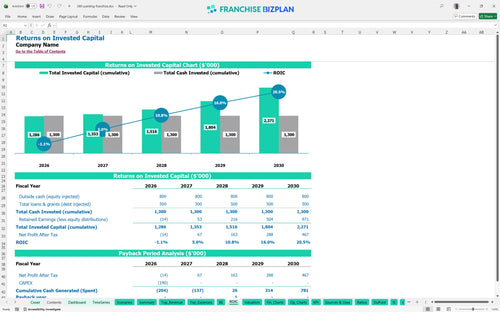
The return on investment analysis shows a 3-year payback period, which is strong for a service-based model. With an IRR of 5.08% and an ROE of 1.21, the model shows steady, predictable growth. It is a marathon, but the cash flow in later years makes the initial investment worth the effort.
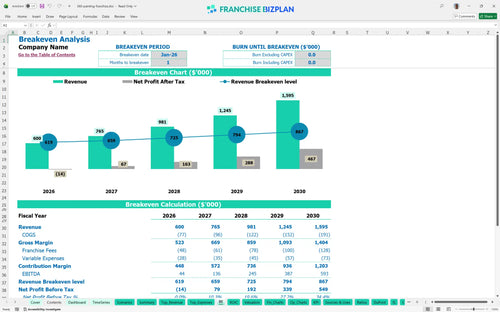
The model indicates a very fast break-even at month one, assuming you launch with a full crew and active sales pipeline. This depends heavily on your sales rep hitting their targets to cover the $2,000 monthly office lease and $7,000 in total monthly fixed costs. Estimating operating expenses for home service businesses is easier when you track these fixed burdens closely.
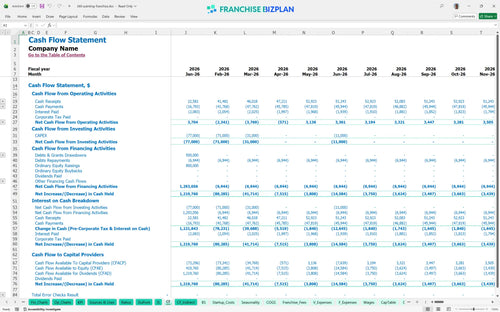
Your lowest cash point is projected for January 2027 at $1.049 million, which includes your initial funding and early operational gains. You need to watch the timing of your vehicle and equipment purchases to avoid temporary dips. A cash flow projection template for franchise units helps you see these movements before they impact your payroll.
A financial model for residential service franchise must account for market shifts and varying demand. High-performance scenarios see revenue jumping toward the $1.59 million mark by year five, while low scenarios might delay your 3-year payback. The model allows you to stress-test your painting business startup costs against slower local sales cycles.
This franchise unit financial model is built in Excel so you can tweak every variable to fit your specific territory. It comes with pre-filled formulas and editable assumptions for this painting concept, making it easy to adjust the residential mix or local labor rates. It is designed to help you build a home service franchise financial plan that actually reflects your local market reality.

Long-term planning is about seeing how a painting business franchise financial projections spreadsheet scales from one crew to a multi-vehicle operation. We have mapped out revenue climbing from $600,000 in year one to over $1.59 million by year five. This provides a clear franchise business financial projection to show lenders or potential partners exactly how the unit matures over time.

You need to know exactly how much cash leaves your business to support the brand. This model tracks the 6% royalty and 2% marketing fund against your gross sales automatically. Analyzing franchise royalty and fee structures is vital because these off-the-top costs hit your bottom line every month, so you must maintain high store-level margins to stay healthy.

Knowing how to calculate startup costs for a painting franchise prevents mid-ramp cash crunches during your first year. We include the $65,000 franchise fee plus $50,000 for service vehicles and $25,000 for painting equipment. This Excel template for franchise unit profitability analysis shows you exactly when you stop burning cash and start keeping it.

We use real-world data to set guardrails for your home service franchise financial plan. For example, paint and primers are modeled at roughly 11% of revenue in the first year. If your actual costs spike higher, the model flags the variance so you can check for waste or pricing errors on your job sites immediately.


Simply purchase and download the financial model template, then access it instantly using Microsoft Excel or Google Sheets. No installation or technical expertise required-just open and start working.

Enter your business-specific numbers, including revenue projections, costs, and investment details. The pre-built formulas will automatically calculate financial insights, saving you time and effort.

Leverage the investor-ready format to confidently showcase your financial projections to banks, franchise representatives, or investors. Impress stakeholders with clear, data-driven insights and professional reports.

Leverage the investor-ready format to confidently present your projections to banks, franchise representatives, or investors.