
All-in-one Dashboard
Core inputs and core outputs


This comprehensive Excel template for real estate franchise financial forecasting provides a ready-to-use framework for analyzing startup capital, monthly P&L, and multi-year ROI.
Core inputs and core outputs
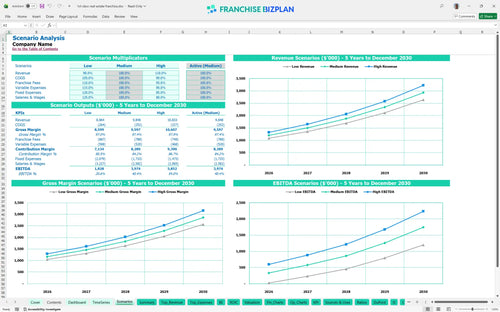
Three scenario analysis
Presentation ready
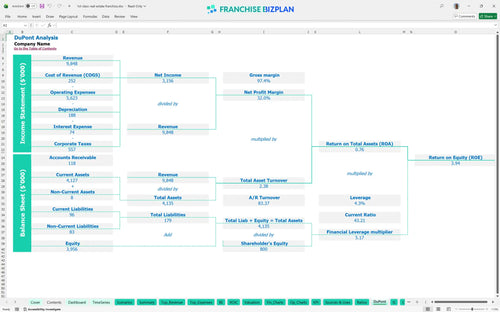
DuPont analysis
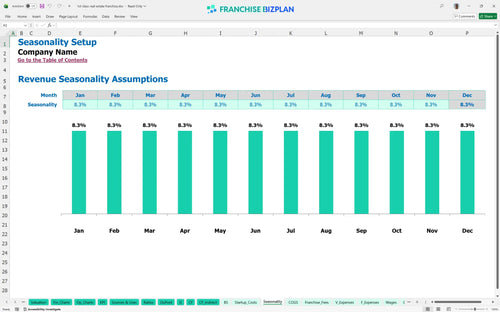
Researched revenue assumptions
Lender-friendly financial outputs
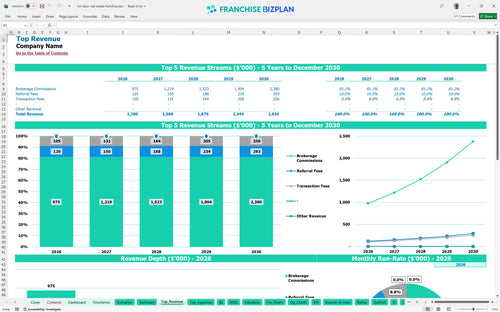
Revenue stream detailed view
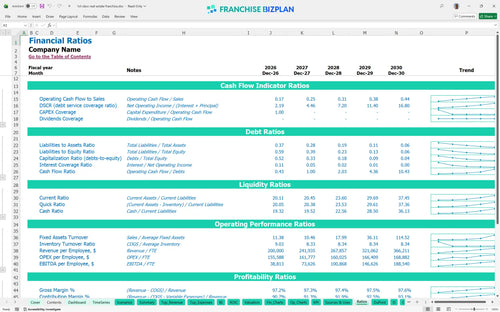
Performance metrics benchmark
We built this franchise unit financial model using our own research to ensure it reflects actual market conditions. Key assumptions like the $1.2M Year 1 revenue target and the 6% royalty structure are pre-populated but fully editable to match your specific territory. This tool provides a data-driven look at how a real estate brokerage business plan translates into store-level EBITDA.
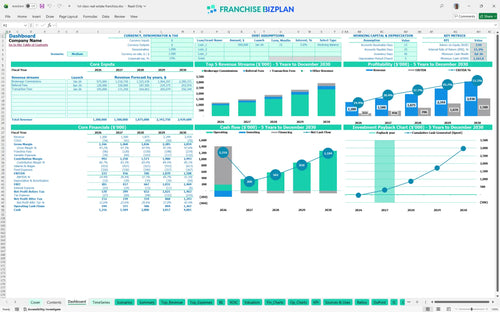
Based on the researched data, this unit hits break-even almost immediately in January 2026, with Year 1 EBITDA reaching $233,000. By Year 5, as brokerage commissions scale to $1.58M, annual EBITDA is projected to climb to $1.5M, showing strong operating leverage. This franchise unit profitability analysis assumes you hit your agent recruitment and retention targets early.
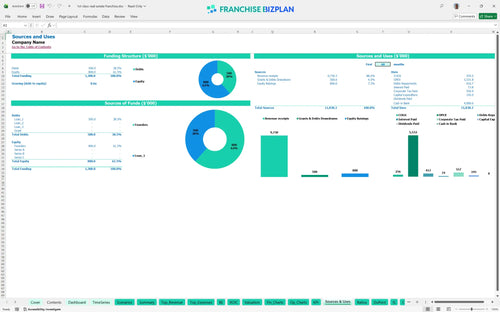
To launch this unit, you need approximately $195,000 in initial CAPEX, though the model indicates a minimum cash requirement of $1.16M by July 2026 to handle ramp-up. This covers the $25,000 franchise fee, $100,000 for office build-out, and $25,000 for furniture. Analyzing real estate franchise startup capital requirements is vital for maintaining franchise liquidity requirements.
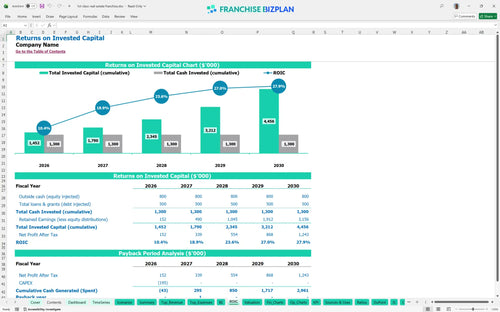
Investors can expect an Internal Rate of Return (IRR) of 15.17% and a Return on Equity (ROE) of 3.94. With a payback period of just 2 years, the model shows a defintely aggressive recovery of the initial investment compared to traditional retail franchises. This real estate franchise investment calculator helps you communicate value to potential partners.
The unit reaches break-even in month 1, requiring enough revenue to cover $15,000 in monthly rent and $27,200 in total fixed expenses. The primary driver for stability is maintaining the $650,000 Year 1 brokerage commission target while managing the 8% total franchise fees. Real estate franchise office lease and occupancy cost planning is the biggest lever here.
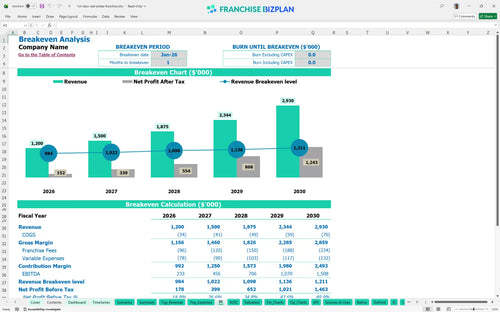
The lowest cash point occurs in July 2026 at $1,162,000, suggesting you need significant liquidity beyond the initial build-out. Analyzing real estate franchise startup capital requirements shows that while the unit is profitable early, working capital timing is critical during the first six months. This real estate brokerage financial model for investors highlights the need for a cash buffer.
Evaluating financial viability of a real estate franchise requires looking at how a 10% revenue drop impacts the 2-year payback. High scenarios accelerate the $2.9M Year 5 revenue target, while Low scenarios test if the $233k Year 1 EBITDA can withstand higher lead acquisition costs. This real estate business model template with lead generation costs helps you plan for volatility.
This real estate franchise financial model is built in Excel, allowing you to tweak every variable from agent splits to local rent. Pre-filled formulas handle the heavy lifting, so you can test different growth paths without breaking the math. It is a fully customizable tool designed for evaluating financial viability of a real estate franchise in any US market.

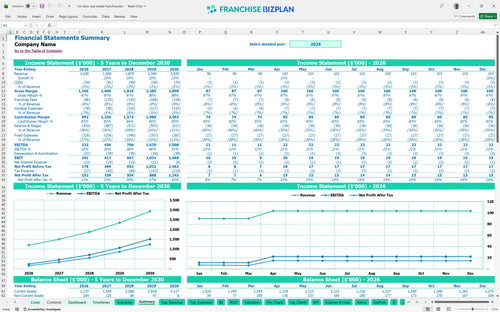
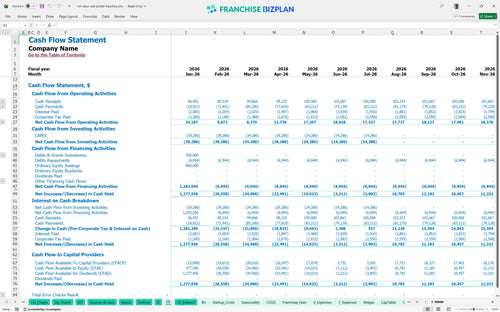
Mapping out a five-year horizon is essential for understanding how brokerage commissions and transaction fees scale over time. This business unit pro forma tracks your transition from a single office to a mature market leader, projecting cash flow and balance sheet health through 2030. It provides the financial projections for new real estate franchise units that lenders require.

The model simplifies estimating franchise royalty fees and commission splits by automating the 6% royalty and 2% marketing fund calculations. You will see exactly how these brand-level obligations impact your store-level margin before you even sign the lease. It is an essential franchise royalty fee calculator for any serious operator.

Use this franchise startup cost template to visualize your $195,000 initial capital outlay, covering everything from the $25,000 franchise fee to office build-out. It calculates the exact sales volume needed to cover your $15,000 monthly rent and fixed overhead. Knowing how to calculate startup costs for a real estate franchise is the first step to securing funding.

We have integrated real-world real estate brokerage operational costs to help you sanity-check your numbers against industry standards. Comparing your planned labor spend or digital lead acquisition costs against these benchmarks ensures your plan stays grounded in reality. This real estate franchise unit profit and loss statement example serves as your financial North Star.


Simply purchase and download the financial model template, then access it instantly using Microsoft Excel or Google Sheets. No installation or technical expertise required-just open and start working.

Enter your business-specific numbers, including revenue projections, costs, and investment details. The pre-built formulas will automatically calculate financial insights, saving you time and effort.

Leverage the investor-ready format to confidently showcase your financial projections to banks, franchise representatives, or investors. Impress stakeholders with clear, data-driven insights and professional reports.

Leverage the investor-ready format to confidently present your projections to banks, franchise representatives, or investors.