
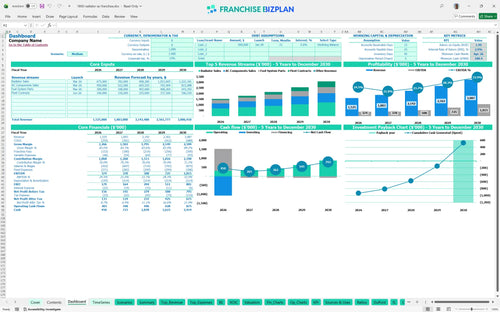
All-in-one Dashboard
Core inputs and core outputs


This franchise unit financial model spreadsheet provides a complete pro forma toolkit including five-year income statements, cash flow projections, and automated ROI calculators for automotive wholesale operators. This tool is the bridge between a dream and a warehouse.
Core inputs and core outputs
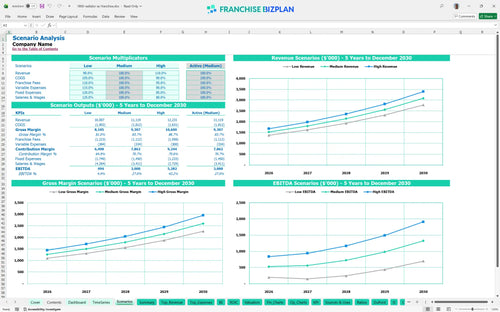
Three scenario analysis
Presentation ready
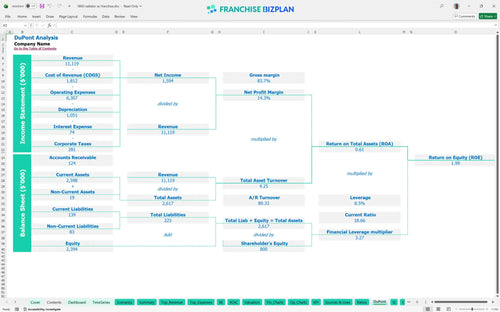
DuPont analysis
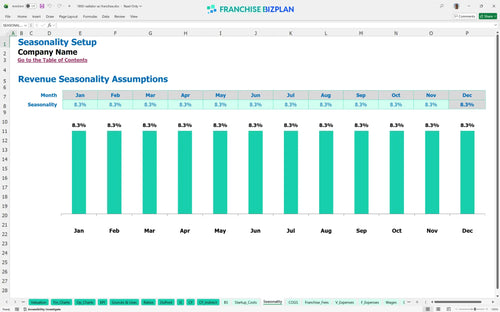
Researched revenue assumptions
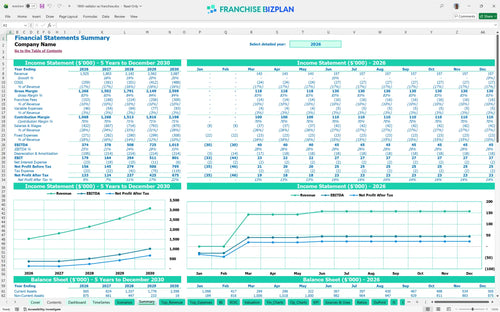
Lender-friendly financial outputs
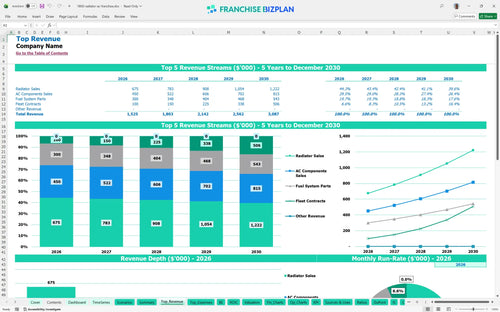
Revenue stream detailed view
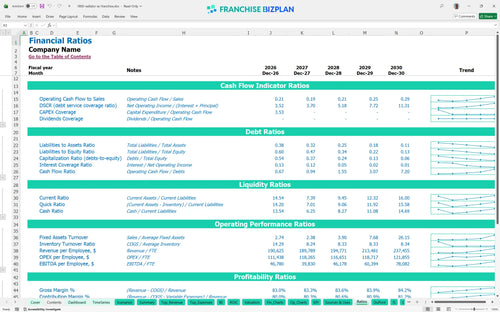
Performance metrics benchmark
We built this auto parts franchise business plan model using research into wholesale cooling systems and parts distribution. Key assumptions, such as the $1,525,000 year-one revenue and the 8% royalty, are pre-populated and fully editable to match your specific market. This tool helps you visualize the path from a $1.07M investment to a $1M EBITDA by year five.
Profitability starts early in this model, with year-one EBITDA hitting $374,000 after accounting for parts procurement and the 2% marketing fee. By year five, financial forecasting for automotive wholesale franchises suggests net profit grows as fleet contracts scale to $506,250 annually. High-volume parts turnover is the engine of this model.
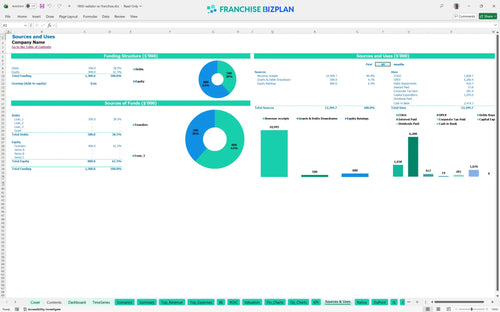
You need about $1,070,000 to launch, with the largest chunk being the $400,000 inventory investment for auto parts franchise operations. This startup cost analysis includes $250,000 for leasehold improvements and $180,000 for the delivery fleet. Your warehouse is your biggest asset and your biggest cost.
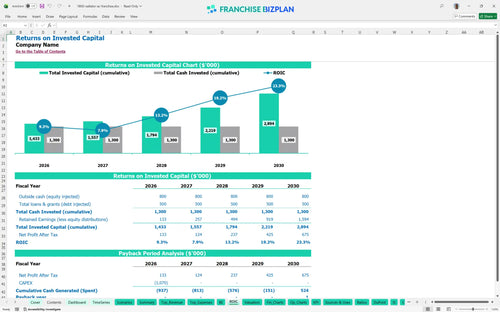
The ROI analysis shows an IRR of 2.87% and a payback period of 5 years. This model calculates a return on equity of 1.99%, reflecting the heavy upfront capital needed for equipment and vehicles. This is a scale game where margin grows with volume.
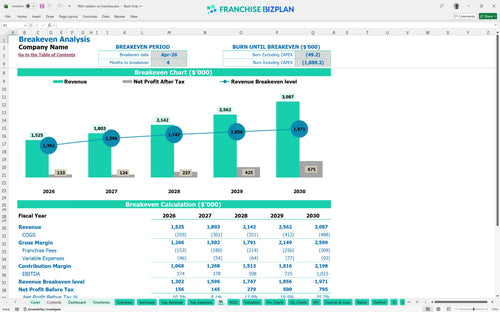
The break-even point calculation shows you hit safety in April 2026, just four months after opening. Reaching this milestone depends on maintaining a steady flow of radiator and A/C component sales to cover the $15,000 monthly warehouse rent. Speed to break-even is the best defense against market shifts.
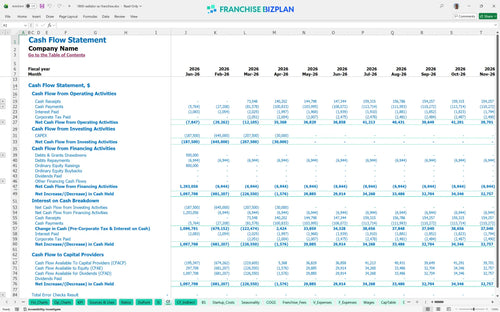
Your cash flow projection shows the lowest point at $188,000 in April 2026. This means you need a healthy buffer to handle the ramp-up of the delivery drivers and warehouse staff. Cash is king when you are waiting for fleet invoices to clear.
Testing franchise investment feasibility across low, medium, and high scenarios shows that year-five revenue could swing between $2.5M and $3.08M. Success defintely depends on your sales reps' ability to secure recurring revenue for fleet service contracts. Scenarios help you plan for the worst while aiming for the best.
This franchise financial model template is a fully customizable Excel tool designed for the automotive wholesale sector. It features pre-filled formulas and editable assumptions that let you adjust for your specific territory, whether you are looking at a single warehouse or a multi-unit expansion. Every cell is open for your local market data.

Planning for the long term is essential when managing a high-inventory business, and this tool provides detailed automotive franchise financial projections over a sixty-month period. You can track how revenue grows from $1.5 million in year one to over $3 million by year five. Five years of data turns a guess into a plan.

This model accurately captures your ongoing operating expense forecast, including the 8% royalty and 2% brand marketing fund contributions. It ensures you see the true store-level margin after the franchisor takes their cut from your gross sales. Royalties are the price of brand power.

Our franchise startup cost analysis helps you map out the $1.07 million required to open your doors, from leasehold improvements to the initial delivery fleet. The model identifies the exact sales volume needed to cover your $15,000 monthly warehouse rent and payroll. Knowing your number keeps the doors open.

The franchise profitability calculator includes built-in benchmarks for the automotive aftermarket, helping you validate your parts procurement costs and labor ratios. You can compare your projected 14% COGS (cost of goods sold) against industry standards to ensure your model is realistic. Benchmarks stop you from flying blind.


Simply purchase and download the financial model template, then access it instantly using Microsoft Excel or Google Sheets. No installation or technical expertise required-just open and start working.

Enter your business-specific numbers, including revenue projections, costs, and investment details. The pre-built formulas will automatically calculate financial insights, saving you time and effort.

Leverage the investor-ready format to confidently showcase your financial projections to banks, franchise representatives, or investors. Impress stakeholders with clear, data-driven insights and professional reports.

Leverage the investor-ready format to confidently present your projections to banks, franchise representatives, or investors.