
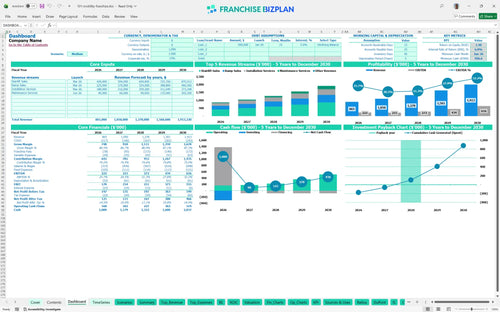
All-in-one Dashboard
Core inputs and core outputs


This Excel template for franchise unit financial projections provides a complete roadmap from initial showroom build-out to five-year cash flow maturity. This tool turns abstract goals into a concrete spreadsheet.
Core inputs and core outputs
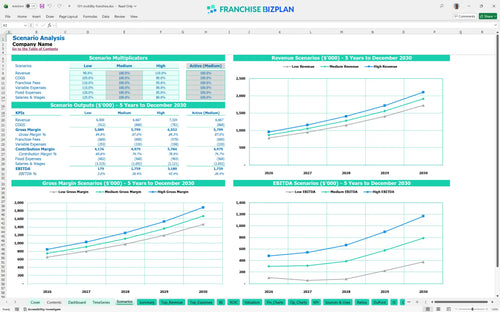
Three scenario analysis
Presentation ready
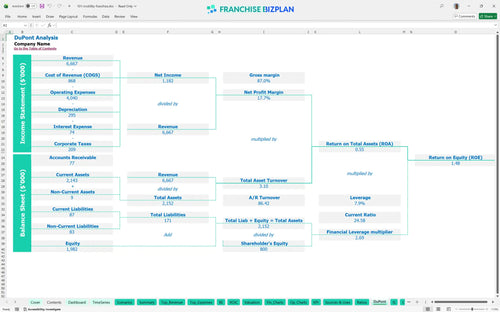
DuPont analysis
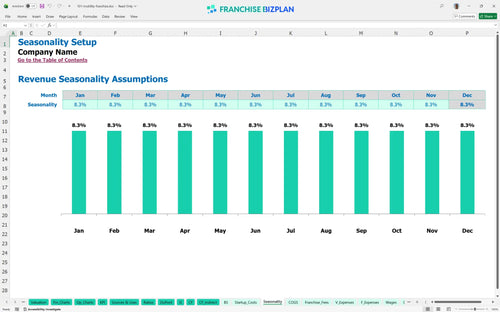
Researched revenue assumptions
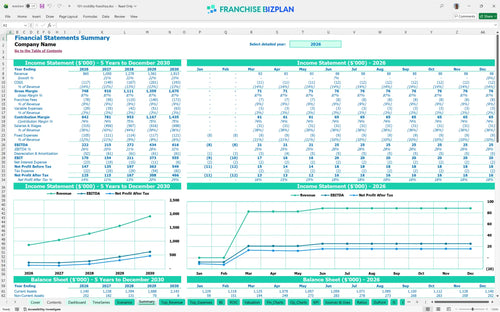
Lender-friendly financial outputs
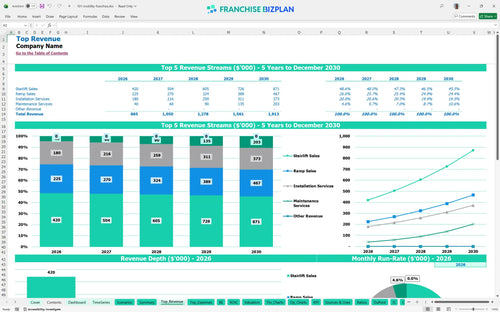
Revenue stream detailed view
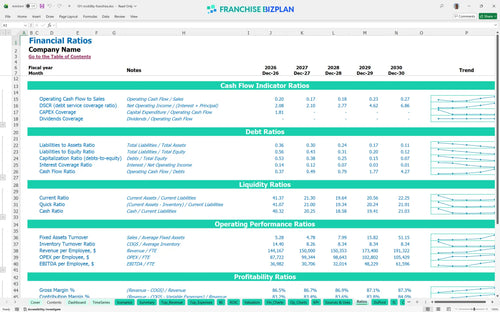
Performance metrics benchmark
We built this medical equipment franchise startup model using our own research to ensure it reflects actual market conditions. Key assumptions like the $865,000 year-one revenue target and the 7% royalty fee are pre-populated and specific to a 101 Mobility Franchise franchise unit. Real data beats a gut feeling every single time. This financial model template for home health franchise is fully editable so you can adjust it to your specific Scottsdale or local territory needs.
Profitability begins in the first year with a projected EBITDA of $222,000. While year two sees a slight dip to $215,000 due to scaling staff, the unit reaches a strong $616,000 EBITDA by year five. Profitability is a function of volume and margin control.
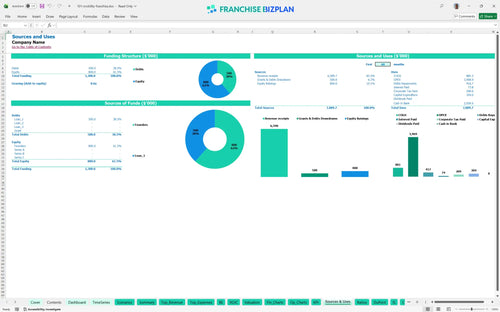
You need approximately $304,000 to cover initial capital expenditure planning and startup costs. This includes the $74,000 franchise fee, $85,000 for showroom improvements, and $45,000 for your service vehicle fleet. Your initial check is just the start of the capital journey.
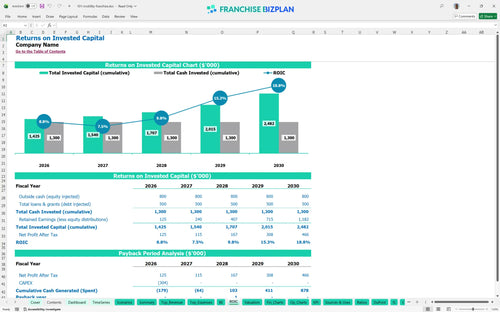
The franchise ROI analysis shows an Internal Rate of Return (IRR) of 5.98% and a Return on Equity (ROE) of 1.48. The model projects a 3-year payback period, which is standard for a service-heavy retail model. A three-year payback is a solid target for this sector.
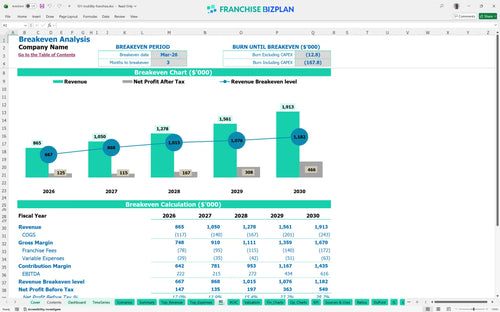
The unit hits its monthly break-even point in March 2026, just three months after opening. Financial planning for medical equipment service business success depends on hitting your installation targets early to cover the $6,000 monthly showroom rent. Speed to break-even is the best predictor of long-term success.
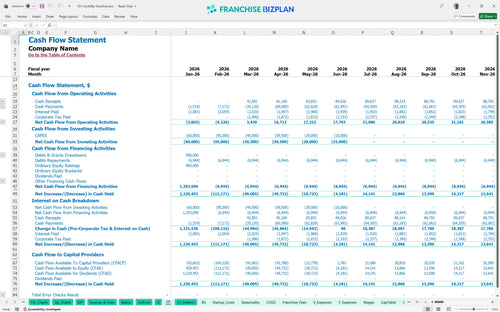
The franchise unit cash flow projection template identifies June 2026 as the lowest cash point at $997,000. This assumes a strong initial capitalization, but you must manage the timing of the $20,000 showroom fixture payment. Cash is oxygen, and you need a full tank to get through year one.
Evaluating profitability of accessibility service franchise units requires looking at how a 10% drop in stairlift sales affects the 5.98% IRR. The high-case scenario assumes you hit the $1.9 million revenue mark by year five through aggressive local marketing. Scenarios help you prepare for the worst while aiming for the best.
Finance: update unit break-even and payback model by Friday.
This franchise financial model template is built entirely in Excel, giving you total control over every variable. You can easily adjust pre-filled formulas and editable assumptions to match your specific territory, whether you are looking at a high-traffic metro area or a smaller suburban market. Every formula is open so you can tweak the math as your local market shifts. This flexibility is vital for any mobility equipment franchise where local labor rates and rent prices can swing your bottom line significantly.

Success in the accessibility industry requires looking past the first year of operations. This franchise business plan template provides detailed 5-year revenue forecasting tools that map out your growth from initial launch to a mature unit or small chain. Long-term planning is the only way to survive the ramp-up phase. You will see exactly how your cash flow and profit margins evolve as you scale from $865,000 in year one to over $1.9 million by year five.

Managing your obligations to the franchisor is simplified with our franchise royalty and fee structure calculator. The model automatically calculates the 7% royalty and 2% marketing fund contributions based on your projected sales, ensuring you understand the real cost of brand support. Knowing your true royalty burden prevents nasty surprises at tax time. It defintely helps you see how these fees impact your store-level EBITDA before you sign the agreement.

We take the guesswork out of how to calculate startup costs for a mobility equipment franchise by including everything from the $74,000 franchise fee to showroom improvements. The break-even analysis for franchise location identifies the exact revenue volume needed to cover your fixed costs like the $6,000 monthly rent. You can't manage what you don't measure, especially during the build-out. This view helps you plan your working capital needs during the critical first few months.

This model includes researched industry benchmarks for labor, occupancy, and gross margins to help you sanity-check your projections. By comparing your expected performance against typical ranges for the mobility sector, you can identify if your staffing costs or equipment COGS are out of alignment. Benchmarks keep your expectations grounded in reality. It is a vital step for any operator looking to maintain a competitive store-level margin while scaling.


Simply purchase and download the financial model template, then access it instantly using Microsoft Excel or Google Sheets. No installation or technical expertise required-just open and start working.

Enter your business-specific numbers, including revenue projections, costs, and investment details. The pre-built formulas will automatically calculate financial insights, saving you time and effort.

Leverage the investor-ready format to confidently showcase your financial projections to banks, franchise representatives, or investors. Impress stakeholders with clear, data-driven insights and professional reports.

Leverage the investor-ready format to confidently present your projections to banks, franchise representatives, or investors.