
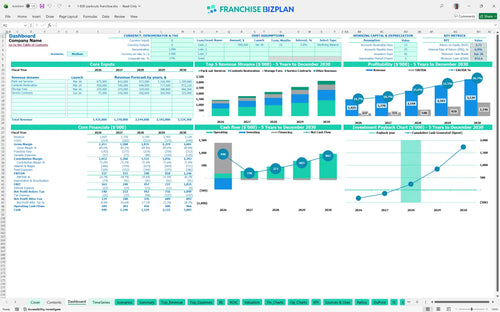
All-in-one Dashboard
Core inputs and core outputs


This franchise unit financial forecasting template provides a complete Excel-based toolkit for projecting revenue, managing expenses, and calculating total investment ROI for a contents restoration business.
Core inputs and core outputs
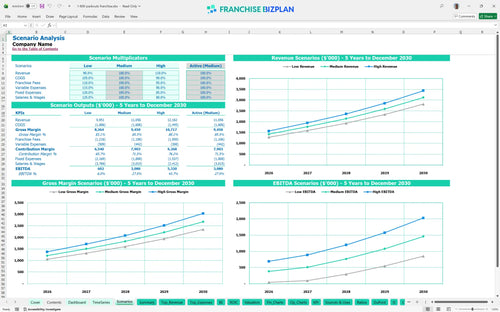
Three scenario analysis
Presentation ready
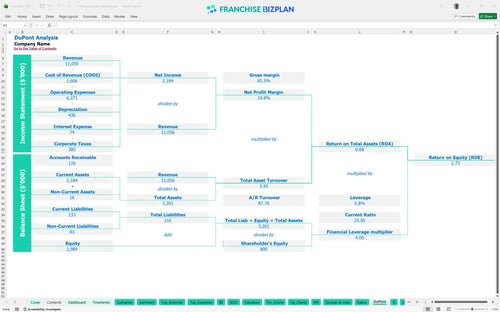
DuPont analysis
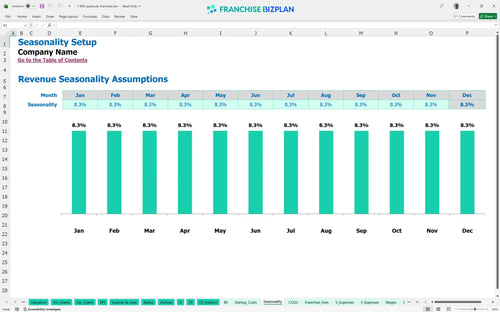
Researched revenue assumptions
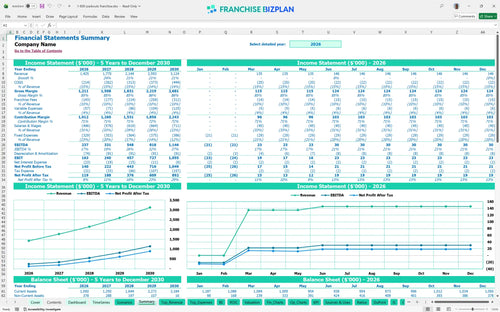
Lender-friendly financial outputs
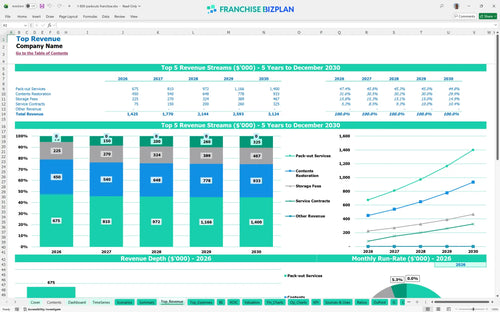
Revenue stream detailed view
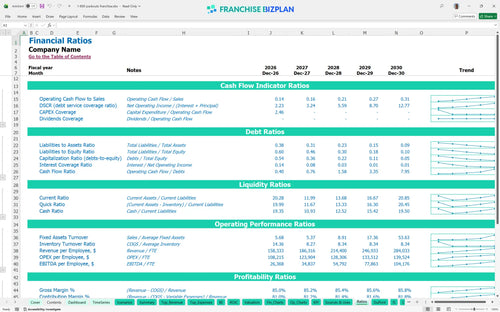
Performance metrics benchmark
We built this franchise unit financial model using our own research into the contents restoration sector. Key assumptions like the $18,000 monthly rent and 7% royalty fees are pre-populated and fully editable to reflect your specific market. With Year 1 revenue projected at $1,425,000, this tool helps you validate the unit economics before you sign the agreement.
This unit is projected to reach its break-even date in April 2026, just 4 months after launch. With Year 3 EBITDA climbing to $548,000, the model shows a strong upward trajectory as service contracts and storage fees mature.
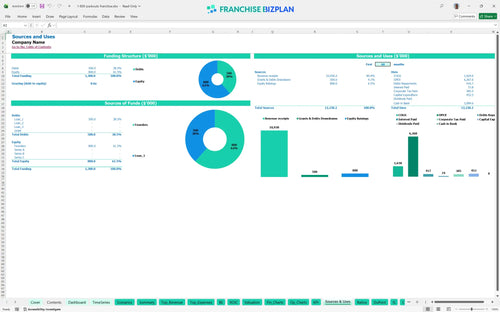
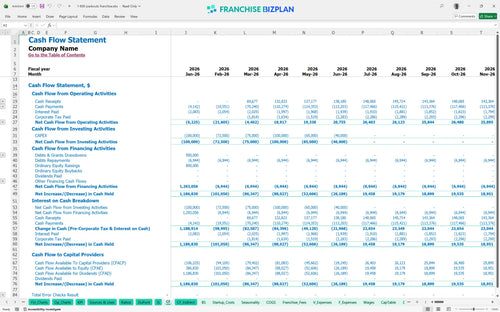
You will need a significant capital injection to launch, with the model showing a minimum cash requirement of $833,000 by June 2026. This covers the $62,500 franchise fee, $150,000 in facility improvements, and $100,000 for climate control systems to protect high-value assets.
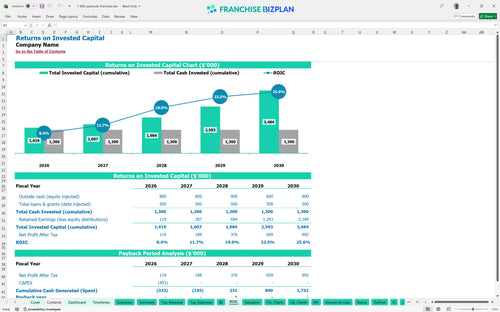
The model projects an Internal Rate of Return (IRR) of 6.04% and a Return on Equity (ROE) of 2.73. With a 3-year payback period, the initial investment is recovered relatively quickly for a capital-intensive restoration business.
The unit hits break-even in month 4, driven primarily by the high-margin pack-out services and storage fees. Fixed costs like the $18,000 monthly rent mean you need consistent volume from insurance adjusters to cover overhead.
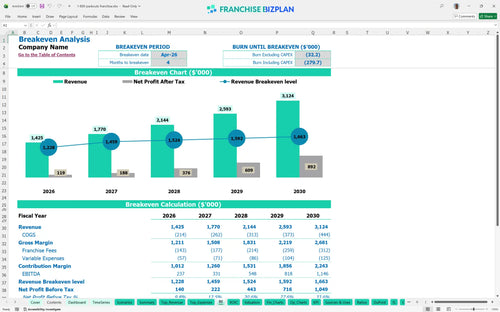
The lowest cash point occurs in June 2026 at $833,000, meaning you need a solid liquidity buffer during the first six months of operations. Estimating operating costs for pack-out services accurately is vital to avoid a cash crunch before the Year 2 revenue of $1,770,000 kicks in.
Projecting revenue for contents restoration services varies based on local disaster frequency. While the medium case shows Year 1 EBITDA of $237,000, a low scenario with 20% less volume could push the payback period past year 4 and significantly increase peak cash needs.
Finance: update unit break-even and payback model by Friday.
This franchise financial model template is fully customizable in Excel, allowing you to tweak every line item for your specific territory. With pre-filled formulas and editable assumptions, you can adjust labor rates or rent to match your local market reality. It's built to handle various operating scenarios, whether you are starting with one truck or a full fleet.

Planning for a disaster recovery franchise requires a long-term view of cash flow and asset replacement. This model provides detailed 5-year revenue, cost, and profit projections to help you see the path from startup to a mature multi-unit operation. You get a clear look at how scaling your contents restoration business plan spreadsheet impacts your bottom line over time.

Understanding profit margins in restoration franchises means accounting for every dollar sent to the franchisor. This tool captures the $62,500 initial franchise fee and calculates ongoing 7% royalties and 3% marketing fund contributions automatically. It ensures you see the store-level EBITDA (earnings before interest, taxes, depreciation, and amortization) after all brand obligations are met.

Use the franchise startup cost calculator to map out your initial investment, from facility improvements to climate control systems. By analyzing fixed and variable costs, the model identifies the exact sales volume needed to stop burning cash. Knowing your break-even point is critical for managing your initial working capital during the ramp-up phase.

We defintely included industry-specific benchmarks to help you sanity-check your restoration business financial plan. Compare your projected labor costs and gross margins against standard restoration sector performance to ensure your model is realistic. This helps you spot if your rent is too high or if your technician productivity is off-target.


Simply purchase and download the financial model template, then access it instantly using Microsoft Excel or Google Sheets. No installation or technical expertise required-just open and start working.

Enter your business-specific numbers, including revenue projections, costs, and investment details. The pre-built formulas will automatically calculate financial insights, saving you time and effort.

Leverage the investor-ready format to confidently showcase your financial projections to banks, franchise representatives, or investors. Impress stakeholders with clear, data-driven insights and professional reports.

Leverage the investor-ready format to confidently present your projections to banks, franchise representatives, or investors.