


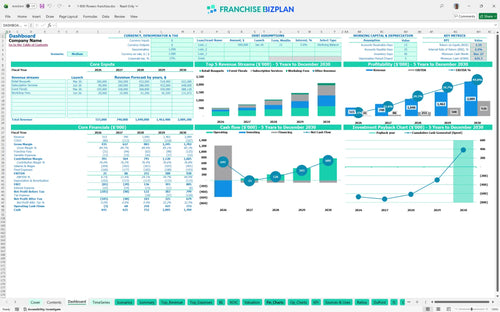
All-in-one Dashboard
Core inputs and core outputs



This product is a complete franchise unit operational budget excel template designed to manage everything from CAPEX planning to multi-year revenue forecasting.
Core inputs and core outputs
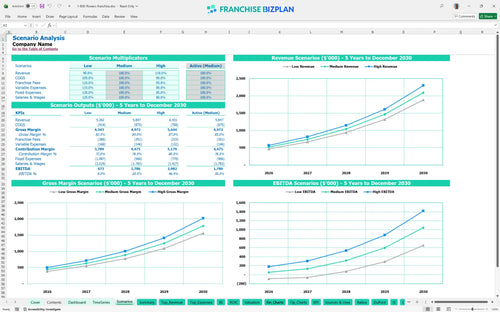
Three scenario analysis
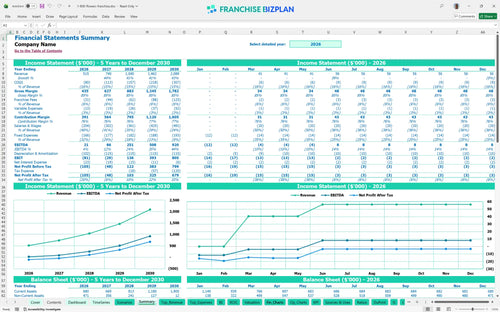
Presentation ready
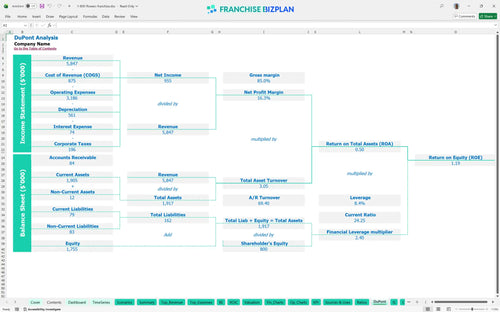
DuPont analysis
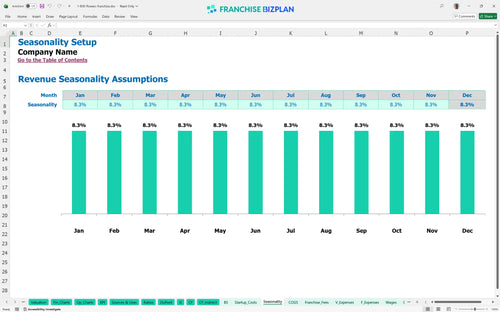
Researched revenue assumptions
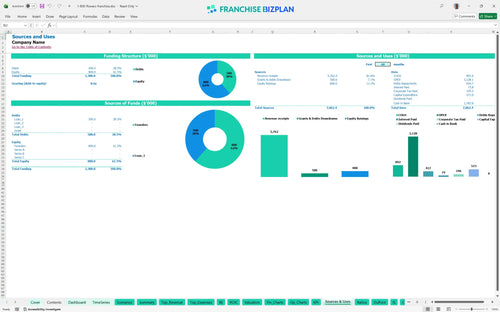
Lender-friendly financial outputs
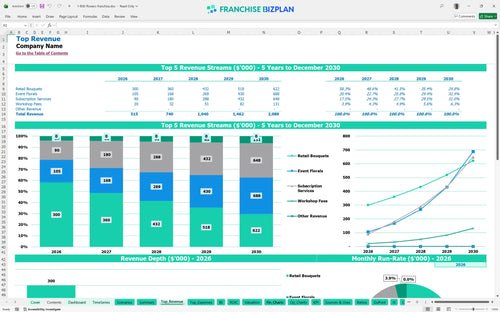
Revenue stream detailed view
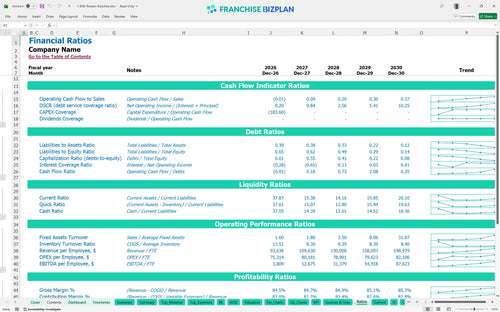
Performance metrics benchmark
We developed this financial model through deep research into the unit economics of high-end floral boutiques. The pre-populated data reflects a path from $515,000 in Year 1 revenue to a mature $2.08 million operation, with all operating expenses and royalty structures ready for your final adjustments.
This unit reaches a positive EBITDA of $21,000 in its first year and scales to $920,000 by Year 5 as revenue matures. When estimating profitability for a boutique floral shop, we factor in the 6% royalty and shifting labor needs to show a net profit after all brand obligations.
Launching this unit in the US requires an initial investment of approximately $573,000, covering the franchise fee, build-out, and specialized equipment. This capital is allocated heavily toward creating a luxury retail environment, with a $625,000 cash floor reached during the 2027 ramp-up phase.
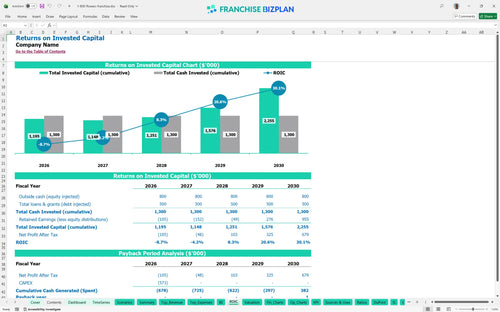
Investors can expect an IRR of 2.22% and a 5-year payback period based on the current growth trajectory. While the initial years focus on recovery, the ROI calculation defintely improves as the unit captures high-ticket event florals and recurring corporate subscriptions.
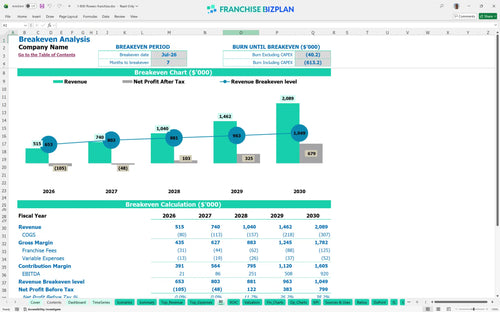
The unit reaches its monthly break-even point in July 2026, just seven months after the initial launch. Determining break-even point for a new franchise unit depends mostly on managing the $10,000 monthly rent and the scaling designer payroll as volume increases.
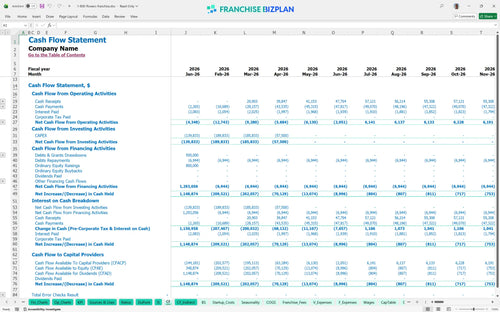
The lowest cash point occurs in December 2027 at $625,000, requiring a disciplined monthly operating budget for retail floral franchise operations. You must maintain a buffer to handle the timing gaps between event deposits and the high cost of premium inventory.
How to forecast revenue for a new franchise location involves comparing scenarios; a 10% revenue lift in the High case significantly accelerates your payback. Conversely, the Low case highlights the risk of high fixed costs like the $10,000 rent if event floral demand lags behind projections.
This franchise financial model is built in Excel with fully editable assumptions, allowing you to tailor every variable to your specific market. You can adjust local labor rates, rent, and product mix to ensure the projections align consistantly with your territory's reality.

Plan for long-term growth with detailed franchise unit financial projections that track your progress from opening day through year five. This tool provides a clear view of how scaling from $515,000 to over $2 million in annual sales impacts your bottom line and cash requirements.

Our model simplifies retail franchise profitability analysis by automating the calculation of the 6% royalty fee and the initial $30,000 investment. It ensures you account for every obligation found in a typical franchise disclosure document (FDD) to see your true take-home pay.

Knowing how to calculate startup costs for a floral franchise is vital when you are facing $250,000 in leasehold improvements and $90,000 in refrigeration units. This break-even analysis identifies the exact monthly volume needed to cover your $10,000 rent and fixed overhead.

This financial model template for retail franchise businesses includes researched benchmarks for operating expenses, such as a 13% cap on fresh flower costs. Use these markers to sanity-check your budget and ensure your floral shop remains competitive within the luxury retail sector.


Simply purchase and download the financial model template, then access it instantly using Microsoft Excel or Google Sheets. No installation or technical expertise required-just open and start working.

Enter your business-specific numbers, including revenue projections, costs, and investment details. The pre-built formulas will automatically calculate financial insights, saving you time and effort.

Leverage the investor-ready format to confidently showcase your financial projections to banks, franchise representatives, or investors. Impress stakeholders with clear, data-driven insights and professional reports.

Leverage the investor-ready format to confidently present your projections to banks, franchise representatives, or investors.