
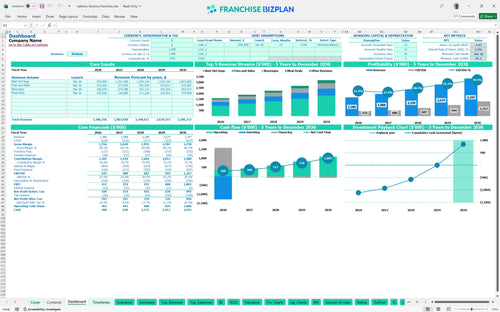
All-in-one Dashboard
Core inputs and core outputs


This comprehensive tool provides a data-driven framework to analyze the startup costs, daily operations, and long-term ROI of a high-volume QSR unit.
Core inputs and core outputs
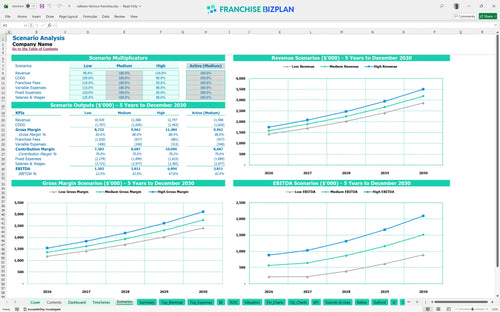
Three scenario analysis
Presentation ready
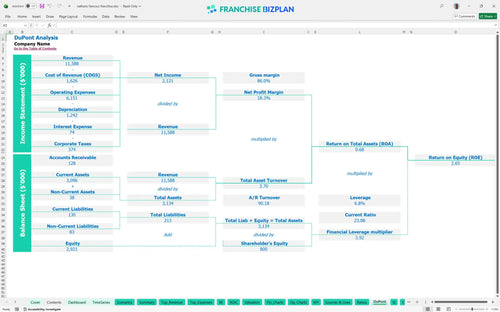
DuPont analysis
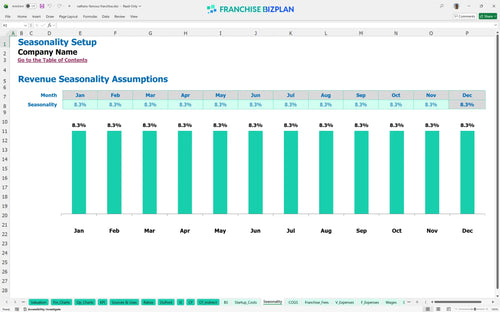
Researched revenue assumptions
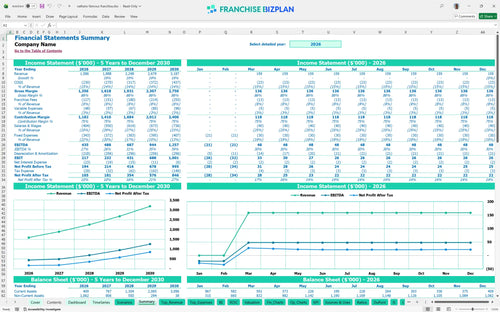
Lender-friendly financial outputs
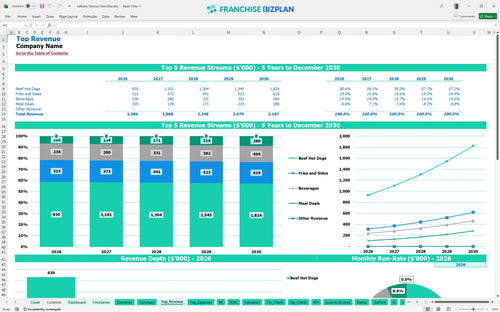
Revenue stream detailed view
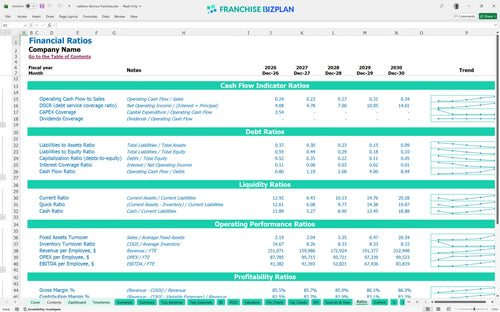
Performance metrics benchmark
We built this franchise unit financial model using our own research to help you navigate this iconic hot dog concept. Key assumptions, including the $18,000 monthly rent and 5.5% royalty fee, are pre-populated and fully editable, showing a Year 1 EBITDA of $435,000. It is a practical resource for any franchise profitability analysis.
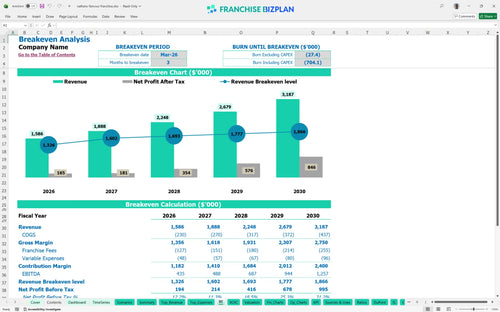
The unit is projected to reach profitability in March 2026, just three months after the grand opening. This quick ramp-up is driven by high-volume sales of beef hot dogs and meal deals, resulting in a Year 1 EBITDA of $435,000 that grows steadily as the brand matures in the local market.
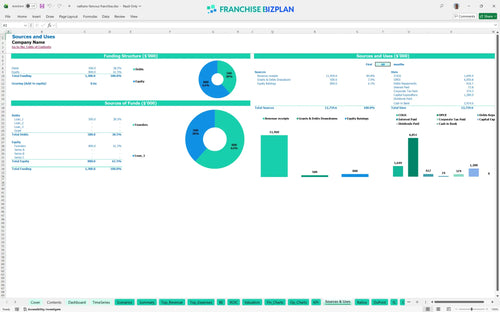
You will need $1,280,000 to launch this unit, which covers capital expenditure planning for high-capacity grills and leasehold improvements. This figure includes the $30,000 initial fee and a necessary cash buffer, showing you exactly how to calculate startup costs for a food franchise without missing hidden pre-opening expenses.
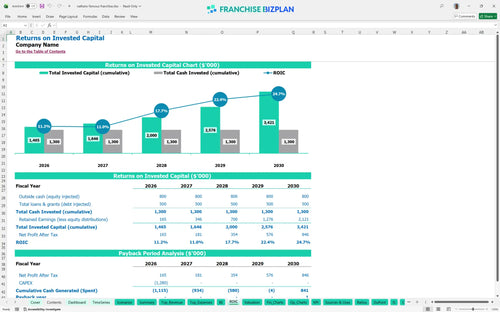
The franchise investment return calculator estimates a 5-year payback period for this high-traffic location. With an Internal Rate of Return (IRR) of 3.18% and a Return on Equity (ROE) of 2.65, the model provides a realistic ROI calculation for operators looking at long-term wealth creation rather than a quick flip.
The monthly break-even analysis shows you need to clear your fixed overhead, including the $18,000 rent and $30,100 in other fixed costs, by month three. Throughput is the biggest lever here; keeping the mobile ordering lane moving is critical to covering your high-visibility real estate costs.
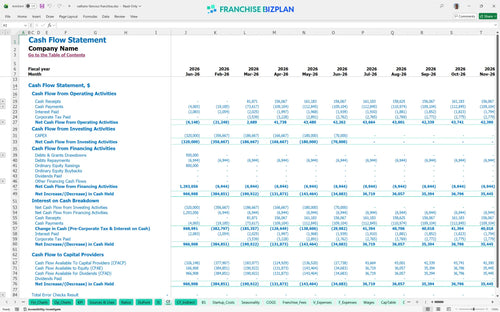
Your lowest cash point hits $81,000 in June 2026, so you must manage your working capital tightly during the first 120 days. Financial forecasting for quick service restaurant units shows that timing your inventory orders and staffing levels during this window prevents a liquidity crunch before the unit reaches full maturity.
The food service business plan financial projections include Low, Medium, and High cases to test your resilience. A High case scenario, fueled by strong local marketing and high average tickets, can significantly boost the Year 1 margin, while the Low case helps you plan for slower tourist seasons on International Drive.
This restaurant franchise financial model Excel template is fully customizable, allowing you to tweak every assumption from menu prices to hourly wages. The pre-filled formulas handle the heavy lifting, so you can focus on testing different operating scenarios for your specific territory and site conditions.

Long-term planning is essential for any restaurant franchise business plan, and this model delivers detailed 5-year outlooks. You can track how revenue scales from $1.58M in Year 1 to over $3.18M by Year 5, ensuring your fast food franchise financial projection accounts for growth and inflation.

This model simplifies how to estimate franchise royalty and marketing fees by using percentage-based triggers tied to your gross sales. It captures the 5.5% royalty and 2.5% brand fund contribution automatically, giving you a clear view of your obligations as outlined in the franchise disclosure document.

Budgeting for a new restaurant franchise location requires precision, and this franchise startup cost spreadsheet breaks down the $1.28M initial investment. You will see exactly when the unit hits its break-even point-projected for March 2026-based on your fixed rent and variable food costs.

We have integrated a franchise unit economic model for beginners that includes standard benchmarks for labor and occupancy. By comparing your $18,000 monthly rent and 14.5% COGS (cost of goods sold) against industry averages, you can defintely spot margin leaks before they impact your bottom line.


Simply purchase and download the financial model template, then access it instantly using Microsoft Excel or Google Sheets. No installation or technical expertise required-just open and start working.

Enter your business-specific numbers, including revenue projections, costs, and investment details. The pre-built formulas will automatically calculate financial insights, saving you time and effort.

Leverage the investor-ready format to confidently showcase your financial projections to banks, franchise representatives, or investors. Impress stakeholders with clear, data-driven insights and professional reports.

Leverage the investor-ready format to confidently present your projections to banks, franchise representatives, or investors.