
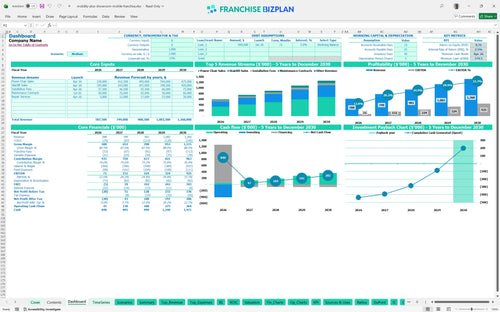
All-in-one Dashboard
Core inputs and core outputs


This healthcare franchise financial projections tool includes detailed tabs for revenue streams, staffing, CAPEX, and full financial statements to guide your investment decision.
Core inputs and core outputs
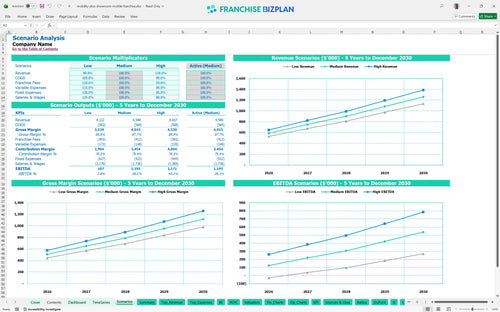
Three scenario analysis
Presentation ready
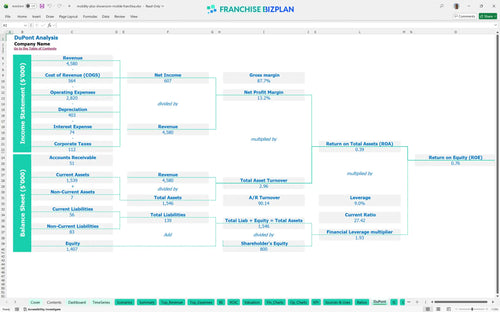
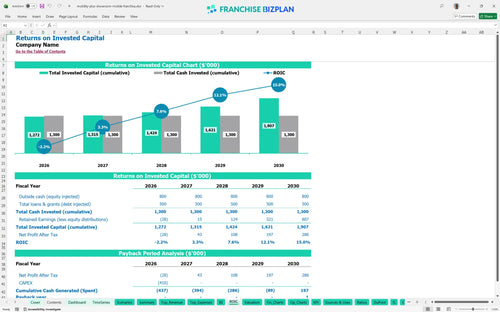
DuPont analysis
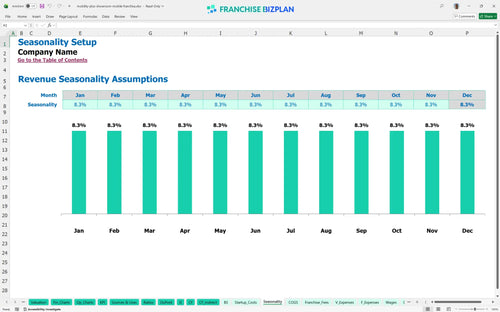
Researched revenue assumptions
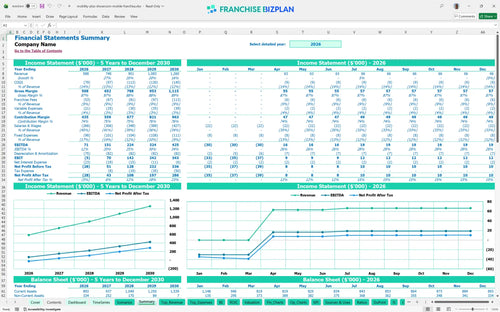
Lender-friendly financial outputs
Revenue stream detailed view
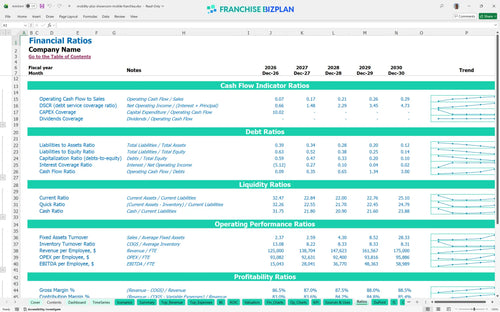
Performance metrics benchmark
We built this franchise unit financial model using our own research to ensure it reflects the reality of the home medical equipment franchise market. Key assumptions, including the $588,000 year-one revenue and 5-month breakeven target, are pre-populated and fully editable to match your specific territory. This is a data-driven tool for serious operators.
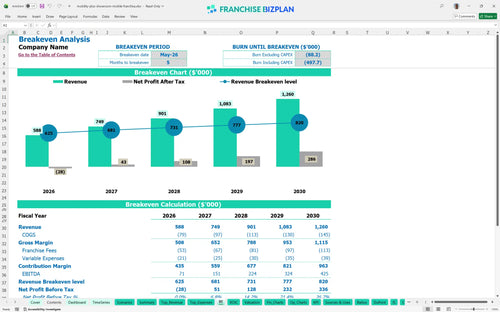
Based on the data, this unit hits EBITDA of $71,000 in the first year and scales to $425,000 by year five. You reach operational profitability quickly because the model shows a breakeven date of May 2026, just five months after launching. Efficiency in the field is what drives the bottom line.
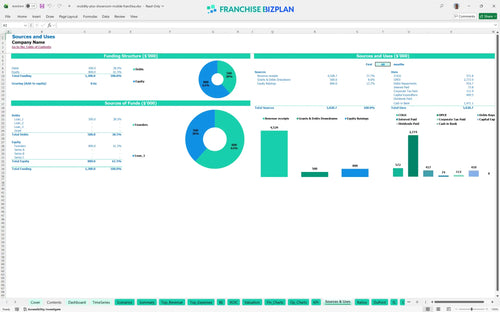
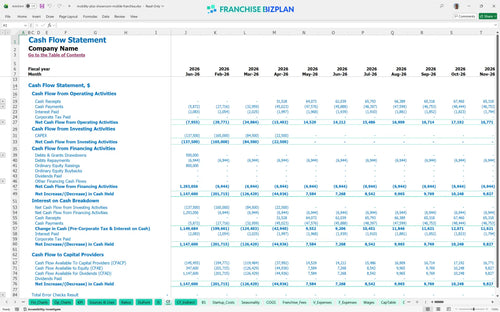
You need a significant initial investment to cover the $29,500 franchise fee, $100,000 in inventory, and $120,000 for showroom improvements. The lowest cash point hits $775,000 in April 2026, suggesting you need a strong capital cushion to handle the ramp-up phase. Cash is king during the first six months.
The internal rate of return (IRR) is 2.46% with a 5-year payback period, which is a steady play for a retail showroom franchise operations model. While the ROE is 0.76, the real value lies in the $425,000 annual EBITDA potential by the fifth year of operation. Patience pays off in the senior care market.
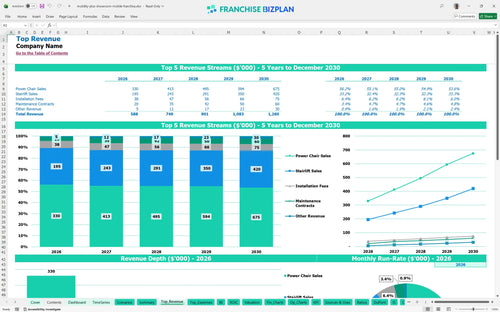
The unit hits its break-even point in May 2026, just five months into operations. This fast start depends heavily on hitting $220,000 in power chair sales during the first year while keeping the $5,000 monthly rent and 7% royalty costs under control. Speed to market determines your early survival.
The lowest cash point occurs in April 2026 at $775,000, which includes your initial startup costs and early operating losses. You need to maintain a healthy buffer because if the showroom build-out takes 90+ days longer than planned, your working capital pressure will spike. Always plan for a rainy day.
Moving to a high scenario significantly boosts the $588,000 year-one revenue and accelerates the 5-year payback. Low scenarios usually extend the 5-month breakeven period, so monitoring the $44,000 sales consultant productivity is vital for staying on the high-growth path. Small wins lead to big outcomes.
This mobility franchise financial model is built in Excel, allowing you to tweak every assumption from power chair sales volume to technician wages. Since local labor rates and rent vary by territory, the editable formulas let you stress-test your specific market before signing a lease. Every 1-point margin leak matters fast in a single-unit model.

We mapped out five years of performance, showing revenue climbing from $588,000 in year one to $1.26 million by year five. This medical equipment franchise business plan tracks how EBITDA (Earnings Before Interest, Taxes, Depreciation, and Amortization) scales as you add more service technicians and mobile vans to your fleet. Growth is a marathon, not a sprint.

The model accounts for the $29,500 initial fee and the ongoing 7% royalty and 2% marketing fund contributions. These fees are baked into the monthly cash flow, so you see exactly how much goes to the brand and how much stays in your pocket after local overhead. Understanding your net contribution is the key to sleeping at night.

Starting a mobile medical equipment service business plan requires knowing your numbers, like the $120,000 showroom build-out and $90,000 for service vans. This franchise startup cost template identifies the exact sales volume needed to cover your $5,000 monthly rent and fixed overhead. Knowing your floor is just as important as knowing your ceiling.

We used real-world data to set benchmarks for mobility franchise financial model performance, including a 7% royalty cap and tiered labor costs. These metrics help you defintely see if your projected margins align with aging-in-place business model standards. If your labor runs over 30%, your bottom line will feel the squeeze immediately.


Simply purchase and download the financial model template, then access it instantly using Microsoft Excel or Google Sheets. No installation or technical expertise required-just open and start working.

Enter your business-specific numbers, including revenue projections, costs, and investment details. The pre-built formulas will automatically calculate financial insights, saving you time and effort.

Leverage the investor-ready format to confidently showcase your financial projections to banks, franchise representatives, or investors. Impress stakeholders with clear, data-driven insights and professional reports.

Leverage the investor-ready format to confidently present your projections to banks, franchise representatives, or investors.