


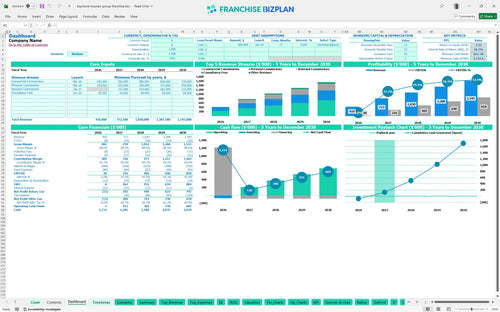
All-in-one Dashboard
Core inputs and core outputs



This insurance franchise unit P&L projection spreadsheet includes integrated financial statements, a detailed CAPEX schedule, and a comprehensive staffing plan tailored for a professional risk management office.
Core inputs and core outputs
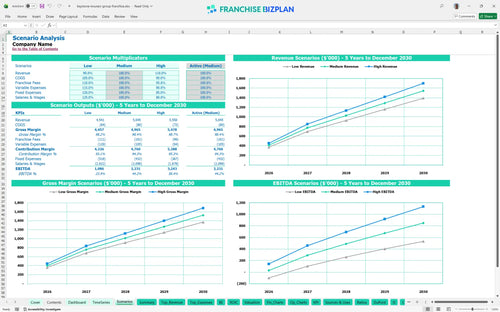
Three scenario analysis
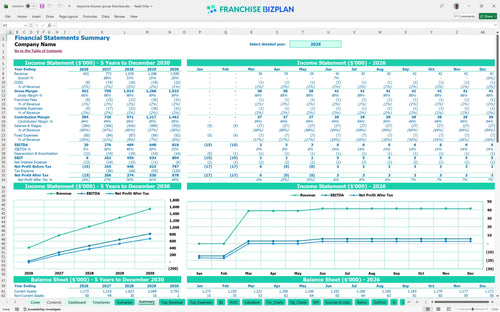
Presentation ready
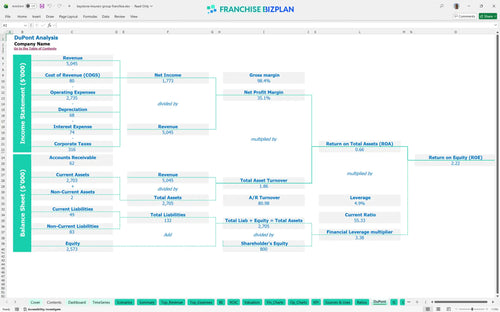
DuPont analysis
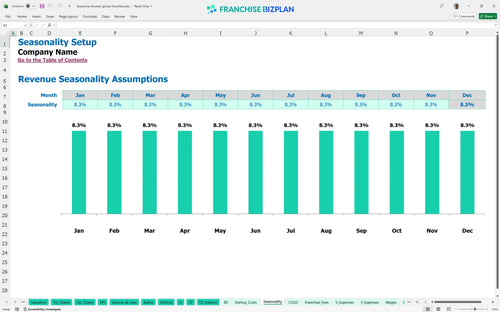
Researched revenue assumptions
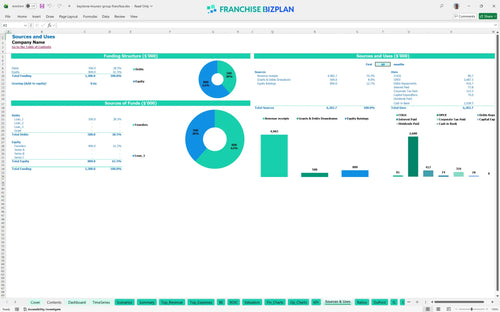
Lender-friendly financial outputs
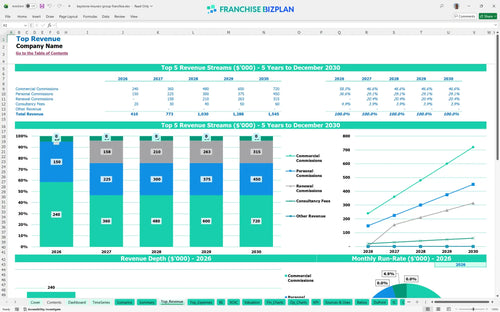
Revenue stream detailed view
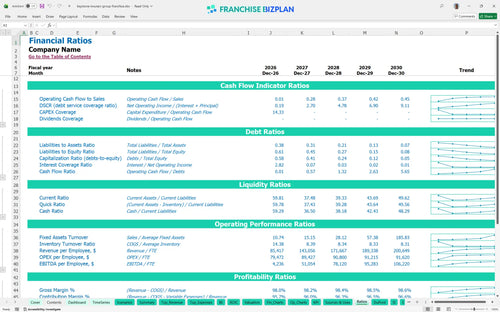
Performance metrics benchmark
We built this insurance franchise unit financial projection using deep-dive research into high-touch agency models. The assumptions for commercial commissions, personal lines, and consultancy fees are pre-populated based on standard performance but remain fully editable for your local market. With a year five EBITDA target of $818,000, this model shows the potential of the independent agency system when backed by a national brand.
The agency hits a positive EBITDA of $20,000 in its first year and scales rapidly as renewal commissions kick in. By year three, EBITDA reaches $469,000 after accounting for all royalties, licensing fees, and a growing staff of licensed agents.
You will need to cover about $70,000 in initial hard costs including the $5,000 franchise fee and $20,000 for office build-out. However, the model shows a minimum cash requirement of $1,152,000 by late 2026, which accounts for the aggressive hiring of licensed agents and sales associates before the revenue fully ramps.
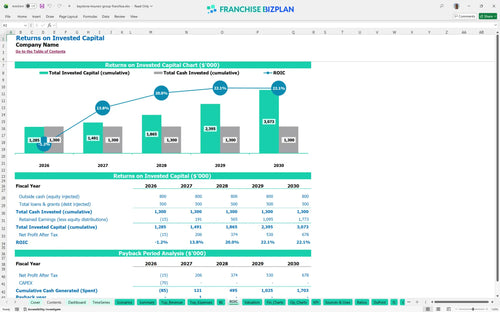
The model projects an Internal Rate of Return (IRR) of 10.74% and a Return on Equity (ROE) of 2.22. This is defintely a strong result for an insurance agency business plan template, especially with a payback period of just 2 years from launch.
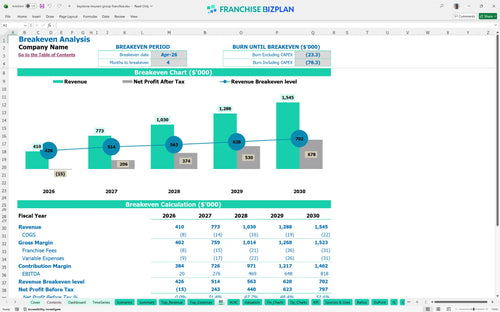
The agency reaches its break-even date in April 2026, just 4 months after opening. The primary driver for hitting this quickly is the volume of commercial commissions, which are forecasted to start at $160,000 in the first year.
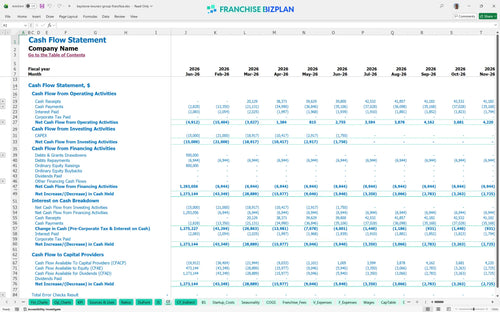
The lowest cash point occurs in December 2026 at $1,152,000, reflecting the heavy investment in professional staff during the first year. You will need a solid credit line or cash reserve to handle the gap between hiring licensed agents and the arrival of renewal premiums.
In a high-growth scenario, hitting $1.5 million in revenue by year five is achievable if renewal commissions stay on track. A low-growth case might delay the 2-year payback, but the 2% royalty fee keeps the burden relatively low compared to other franchise concepts.
Finance: update unit break-even and payback model by Friday.
This insurance franchise financial model is built in Excel with fully editable assumptions, allowing you to swap our researched data for your specific territory reality. You can adjust commission splits, local rent, and staffing levels to see how they impact your bottom line in real-time. It is a flexible tool designed to handle the nuances of insurance agency profitability without needing a degree in finance.

Planning for the long haul is vital in the insurance world where renewals drive value. This model projects five years of performance, showing a trajectory from $410,000 in year one revenue up to $1,545,000 by year five. It maps out the transition from a startup office to a mature, high-volume agency with detailed cash flow and profit views.

The model specifically tracks your obligations to the franchisor, including the 2% royalty fee on gross revenue. With a $5,000 initial franchise fee and zero marketing fund contribution currently modeled, you can see exactly how much of your commission stays in the agency. This clarity helps you understand the real unit economics after the brand takes its cut.

Knowing how to calculate startup costs for an insurance franchise is the first step to avoiding a cash crunch. This tool aggregates your $20,000 leasehold improvements, $10,000 in workstations, and other CAPEX to define your total entry cost. It then calculates the exact month you stop burning cash and start generating a surplus.

We have included benchmarks for key expenses like the $4,500 monthly office rent and agency principal salary of $90,000. These help you sanity-check your insurance agency profitability model against typical industry standards. If your labor or rent costs deviate too far from these norms, the model highlights where your margins might be at risk.


Simply purchase and download the financial model template, then access it instantly using Microsoft Excel or Google Sheets. No installation or technical expertise required-just open and start working.

Enter your business-specific numbers, including revenue projections, costs, and investment details. The pre-built formulas will automatically calculate financial insights, saving you time and effort.

Leverage the investor-ready format to confidently showcase your financial projections to banks, franchise representatives, or investors. Impress stakeholders with clear, data-driven insights and professional reports.

Leverage the investor-ready format to confidently present your projections to banks, franchise representatives, or investors.