
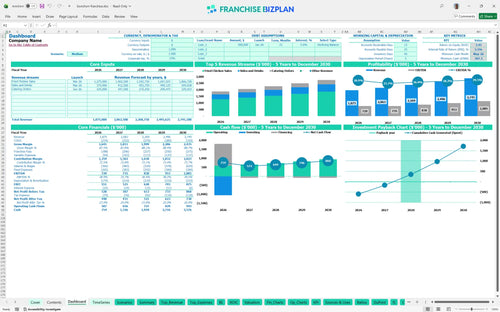
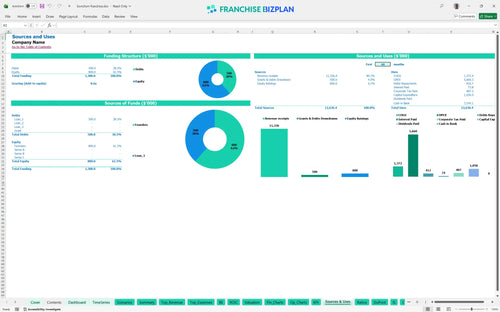
All-in-one Dashboard
Core inputs and core outputs


This comprehensive restaurant profit and loss template includes everything from detailed CAPEX schedules to multi-scenario revenue forecasting for a modern chicken franchise.
Core inputs and core outputs
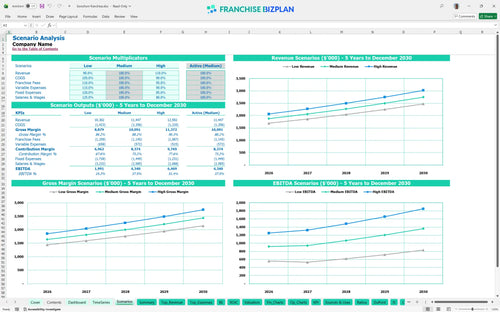
Three scenario analysis
Presentation ready
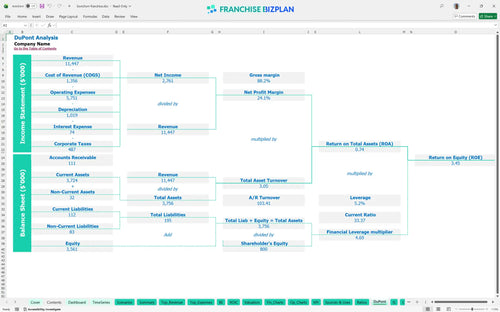
DuPont analysis

Researched revenue assumptions
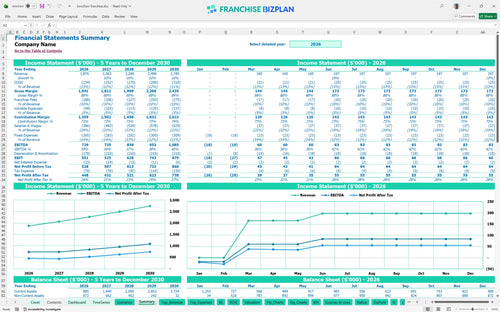
Lender-friendly financial outputs
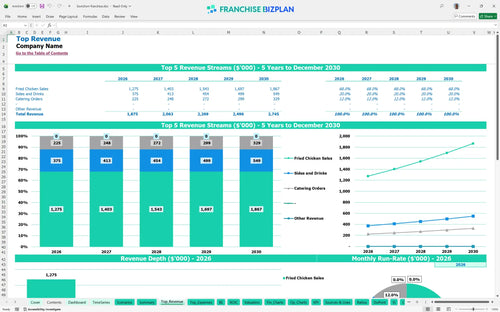
Revenue stream detailed view
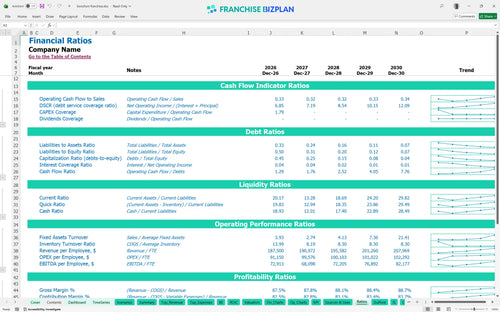
Performance metrics benchmark
We built this franchise unit financial model using our own deep-dive research into the unit economics of this specific chicken concept. Key assumptions like the $1,875,000 year-one revenue and the 5% royalty structure are pre-populated and ready for you to edit. This tool provides a detailed financial plan for opening a chicken restaurant so you can focus on operations instead of building spreadsheets.
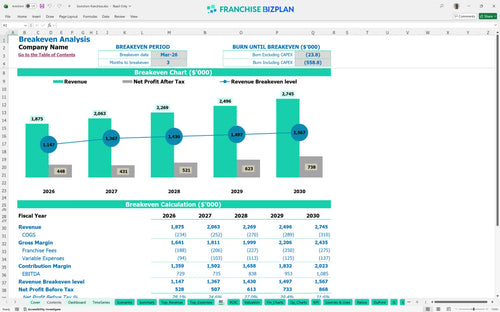
Your unit is projected to hit profitability very quickly, reaching break-even by March 2026, just three months after launch. With first-year EBITDA estimated at $729,000, the model shows a strong upward trend as revenue grows toward $2.7M by year five. This assumes you manage the 12.5% combined COGS and keep a tight lid on the $16,000 monthly rent.
You will need approximately $1,050,000 to get this unit off the ground in the US market. This covers the $35,000 franchise fee, $450,000 for build-out, and $250,000 for high-end kitchen gear. The model also accounts for $30,000 in initial inventory and a $25,000 grand opening budget to ensure you start with enough momentum.
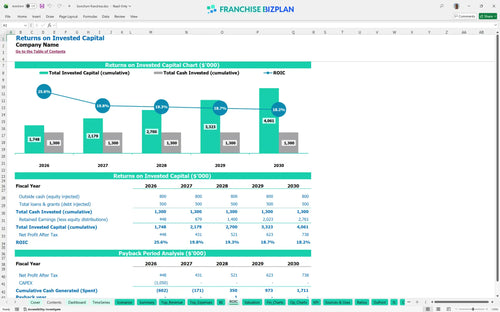
This franchise investment analysis shows a 3-year payback period, which is quite competitive for the fast-casual sector. You are looking at an Internal Rate of Return (IRR) of 5.52% and a Return on Equity (ROE) of 3.45%. While these numbers are steady, the real value lies in the long-term cash flow, with EBITDA exceeding $1M by the fifth year of operation.
You need to hit your break-even point by March 2026 to stay on track with the model's projections. The biggest drivers affecting this timeline are your $19,200 combined monthly fixed costs and the 10% total royalty and marketing burden. Analyzing net income for food and beverage franchise units shows that maintaining high traffic in those first 90 days is defintely critical.
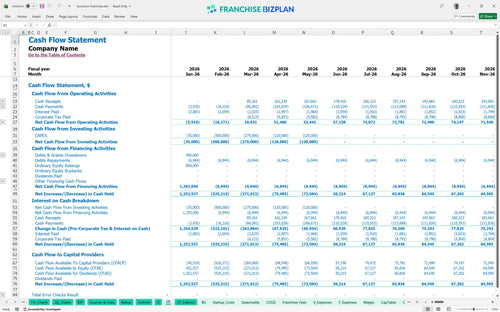
The model identifies May 2026 as your lowest cash point, with a minimum cash balance of $307,000. This suggests you have a healthy buffer, but you still need to watch the timing of your $80,000 POS and digital system payments. If build-out takes longer than expected, that runway could shrink, so keeping a close eye on the commercial real estate lease cost analysis for franchises is a smart move.
Moving from a medium to a high-revenue scenario significantly accelerates your franchise ROI analysis and boosts year-one margins. The model allows you to toggle revenue and expense variables to see how a 10% dip in sales impacts your ability to cover the $68,000 manager salary. High-performing units usually win by mastering local marketing execution and driving repeat catering orders, which start at $150,000 in year one.
Finance: update unit break-even and payback model by Friday.
This franchise financial model is built in Excel so you can tweak every assumption to fit your specific territory. Whether you are adjusting the $16,000 monthly rent for a different zip code or changing the 5% royalty fee, the pre-filled formulas handle the math instantly. It's a flexible tool designed to help you stress-test your restaurant franchise business plan before signing a lease.

Planning for the long haul requires more than just a year-one estimate. This model provides a detailed 5-year outlook, showing revenue climbing from $1,875,000 to over $2,745,000 as your unit matures. You get a clear view of how your balance sheet and cash flow evolve as you scale from a single unit to a potential multi-unit operation.

Managing the ongoing cost of the brand is vital for maintaining your store-level margin. This template tracks the initial $35,000 franchise fee alongside the combined 10% for royalties and marketing funds. Estimating franchise royalty and marketing fees correctly ensures you know exactly how much cash stays in the business after corporate takes its cut.

Opening a high-end chicken restaurant involves significant upfront capital, including $450,000 for leasehold improvements and $250,000 for kitchen equipment. This franchise startup cost calculator helps you map out every dollar of the initial investment. Knowing your break-even sales level is the best way to manage risk during those first few critical months of trading.

We've integrated industry-standard benchmarks so you can see if your 10.5% food cost or your staffing plan aligns with top-tier fast-casual performance. Using these best practices for franchise unit financial projections keeps your model realistic and defensible for lenders or partners. It's about making sure your operational expense breakdown for new franchise locations actually makes sense in the real world.


Simply purchase and download the financial model template, then access it instantly using Microsoft Excel or Google Sheets. No installation or technical expertise required-just open and start working.

Enter your business-specific numbers, including revenue projections, costs, and investment details. The pre-built formulas will automatically calculate financial insights, saving you time and effort.

Leverage the investor-ready format to confidently showcase your financial projections to banks, franchise representatives, or investors. Impress stakeholders with clear, data-driven insights and professional reports.

Leverage the investor-ready format to confidently present your projections to banks, franchise representatives, or investors.